

Configuration Options
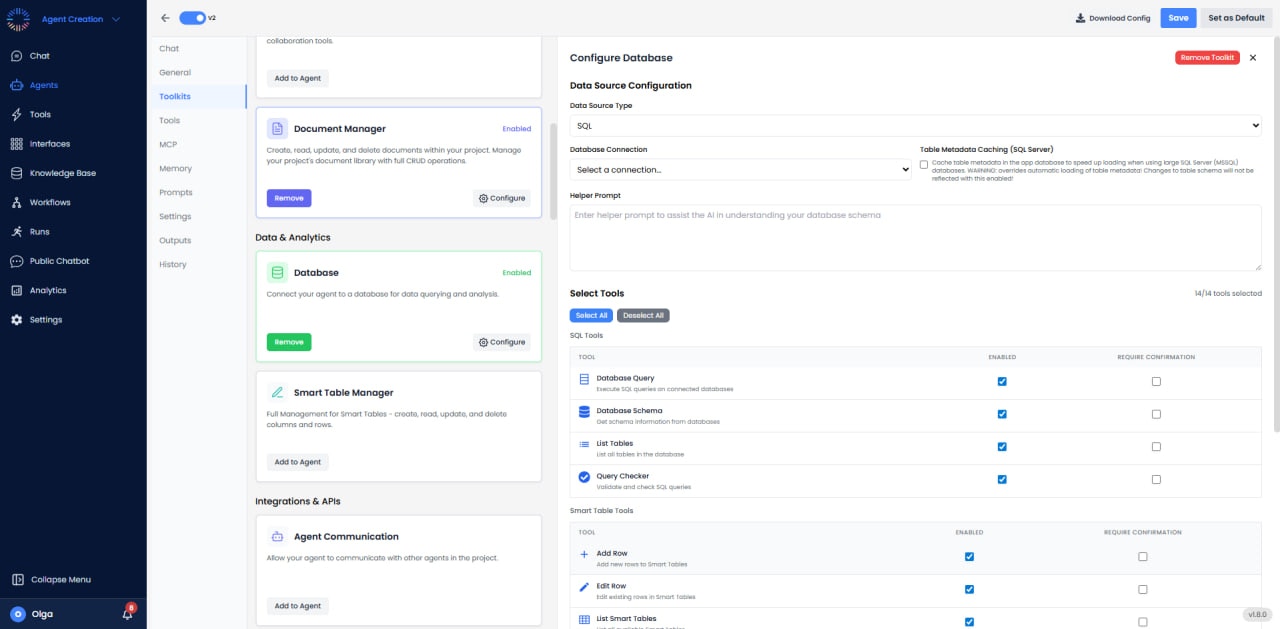
- Data Source Type: Choose between SQL (external databases), Smart Tables (internal data), or CSV/Excel files.
- Database Connection: Select from configured database connections for SQL data sources.
- Table Metadata Caching: For SQL Server, optionally cache table metadata to speed up loading with large databases.
- Helper Prompt: Provide additional context to help the AI understand your database schema and structure.
Available Tools
The Database Toolkit provides 14 tools organized into four categories:SQL Tools (4 tools)
- Database Query: Execute SQL queries on connected databases to retrieve and analyze data.
- Database Schema: Get comprehensive schema information from databases including tables, columns, and relationships.
- List Tables: List all tables available in the connected database.
- Query Checker: Validate and check SQL queries for syntax errors before execution.
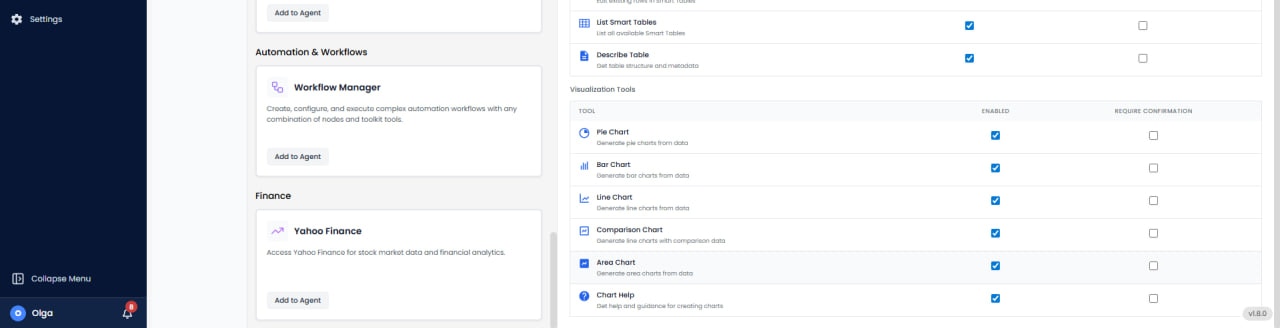
Smart Table Tools (4 tools)
- Add Row: Add new rows to Smart Tables for data entry and record creation.
- Edit Row: Edit existing rows in Smart Tables to update data values.
- List Smart Tables: List all available Smart Tables in the current project.
- Describe Table: Get detailed table structure and metadata including column definitions and data types.
Visualization Tools (6 tools)
- Pie Chart: Generate pie charts from data to show proportions and percentages.
- Bar Chart: Generate bar charts from data for comparing values across categories.
- Line Chart: Generate line charts from data to visualize trends over time.
- Comparison Chart: Generate line charts with comparison data for multi-series analysis.
- Area Chart: Generate area charts from data to show cumulative totals and trends.
- Chart Help: Get help and guidance for creating charts with best practices and examples.
Use Cases
- Business Intelligence: Query sales databases to generate revenue reports with automatic chart visualization.
- Data Analysis: Analyze customer data from Smart Tables and create trend visualizations.
- Report Automation: Execute scheduled queries and generate formatted reports with charts.
- Database Exploration: Use schema tools to understand database structure and relationships.
- Data Validation: Check SQL queries before execution to prevent errors.
- Dashboard Creation: Build interactive dashboards with multiple chart types from database queries.