

Introduction to Smart Tables
Smart Tables are a structured data management feature within the Knowledge Base (KB) that allow you to store, organize, and extract information in a tabular format. Unlike standard spreadsheets, Smart Tables are integrated with AI capabilities, enabling automatic data extraction from documents, relationship mapping between different data sets (Collections), and direct querying via AI Agents. Key capabilities include:- Defining structured schemas — columns, data types, and formats
- Extracting data automatically from uploaded files (e.g., Resumes, Invoices)
- Visualizing data through built-in dashboards
- Querying table data using natural language via Agents
Accessing Smart Tables
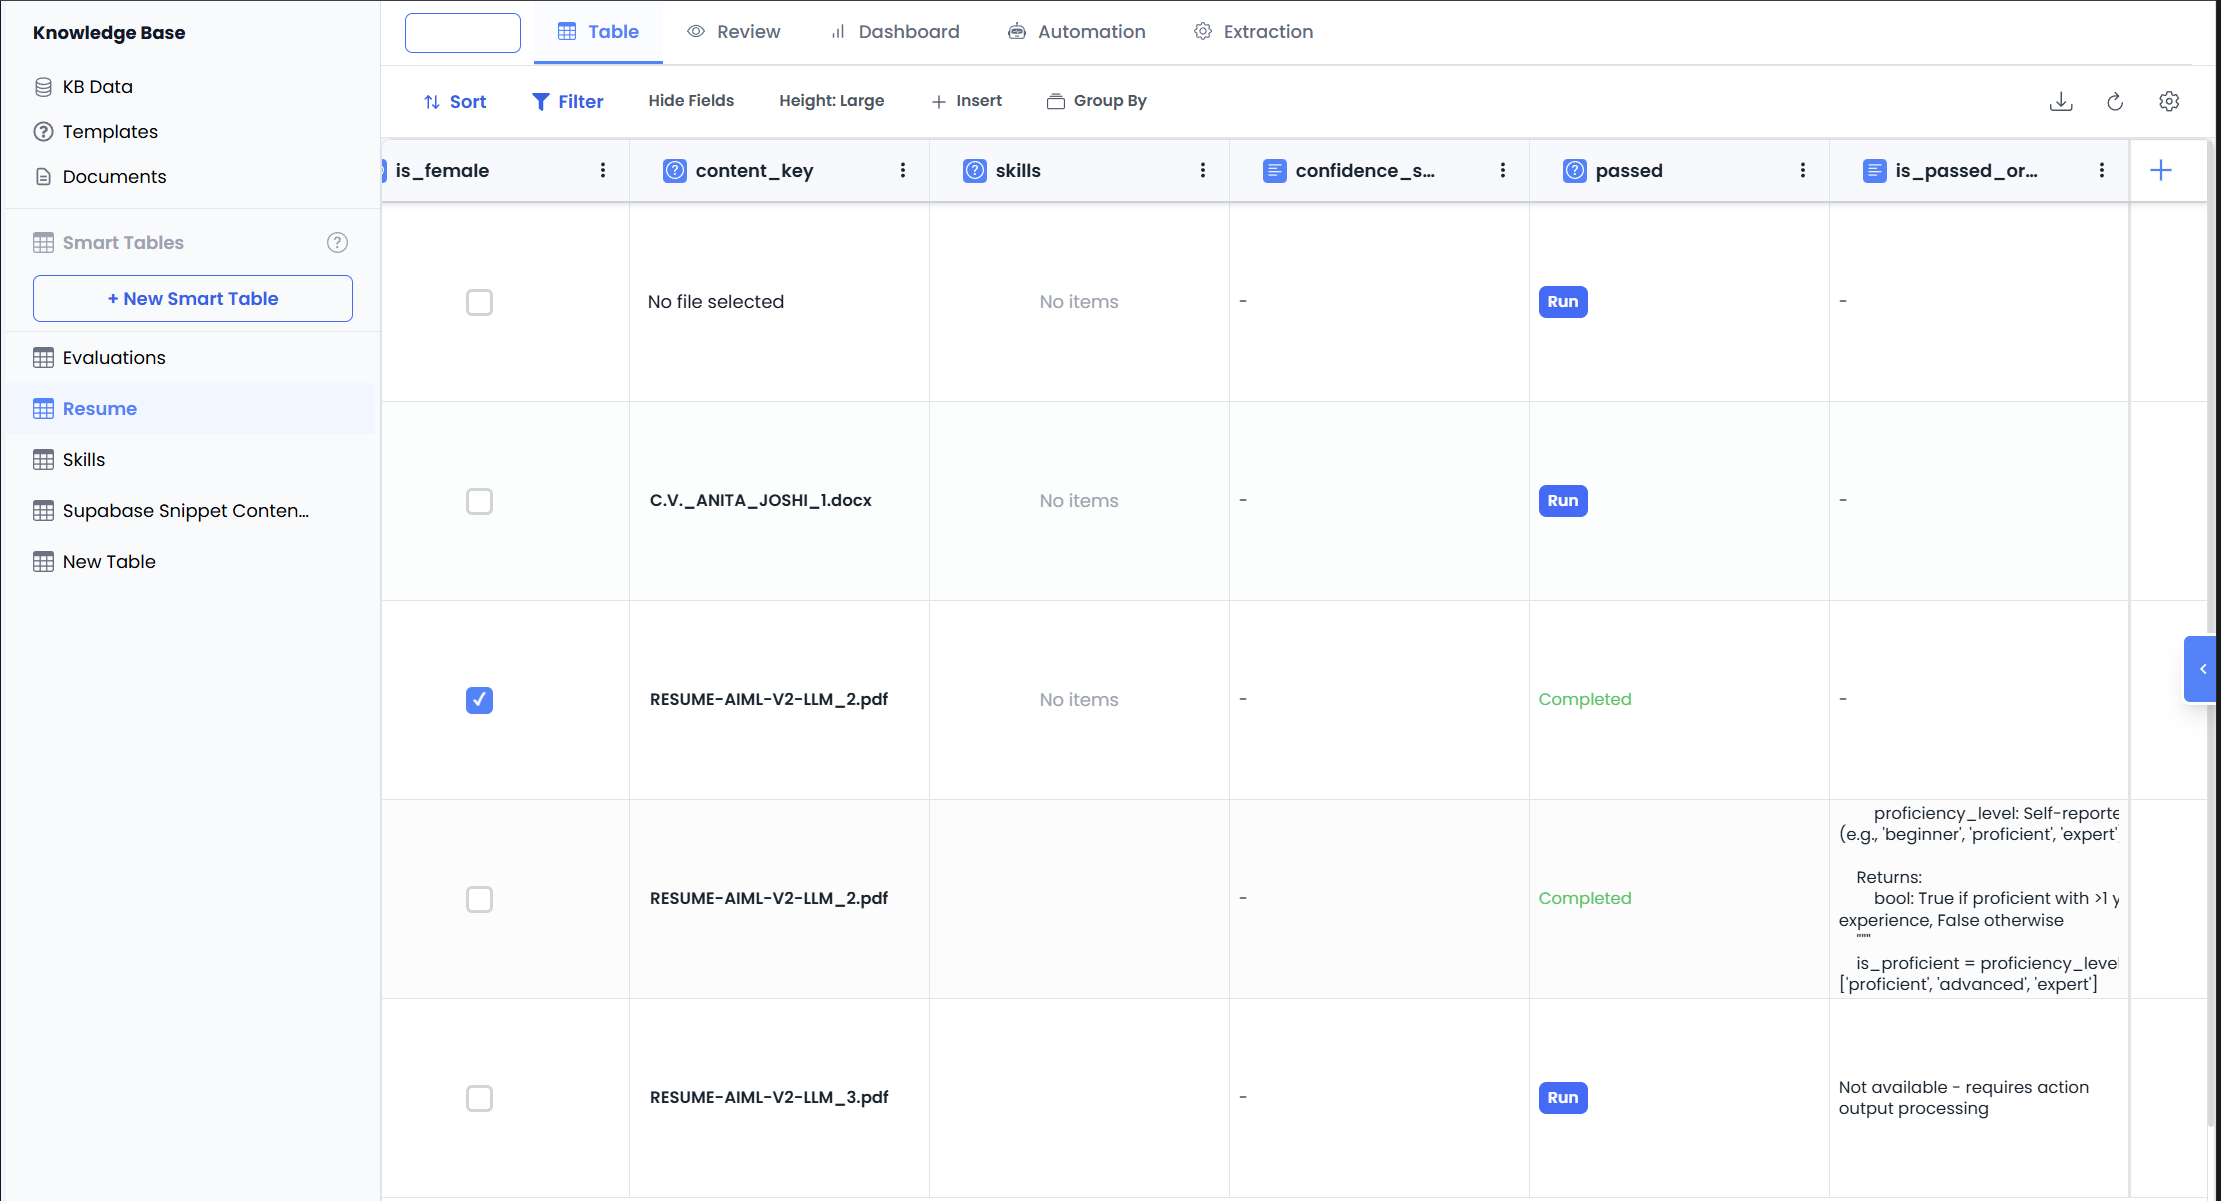
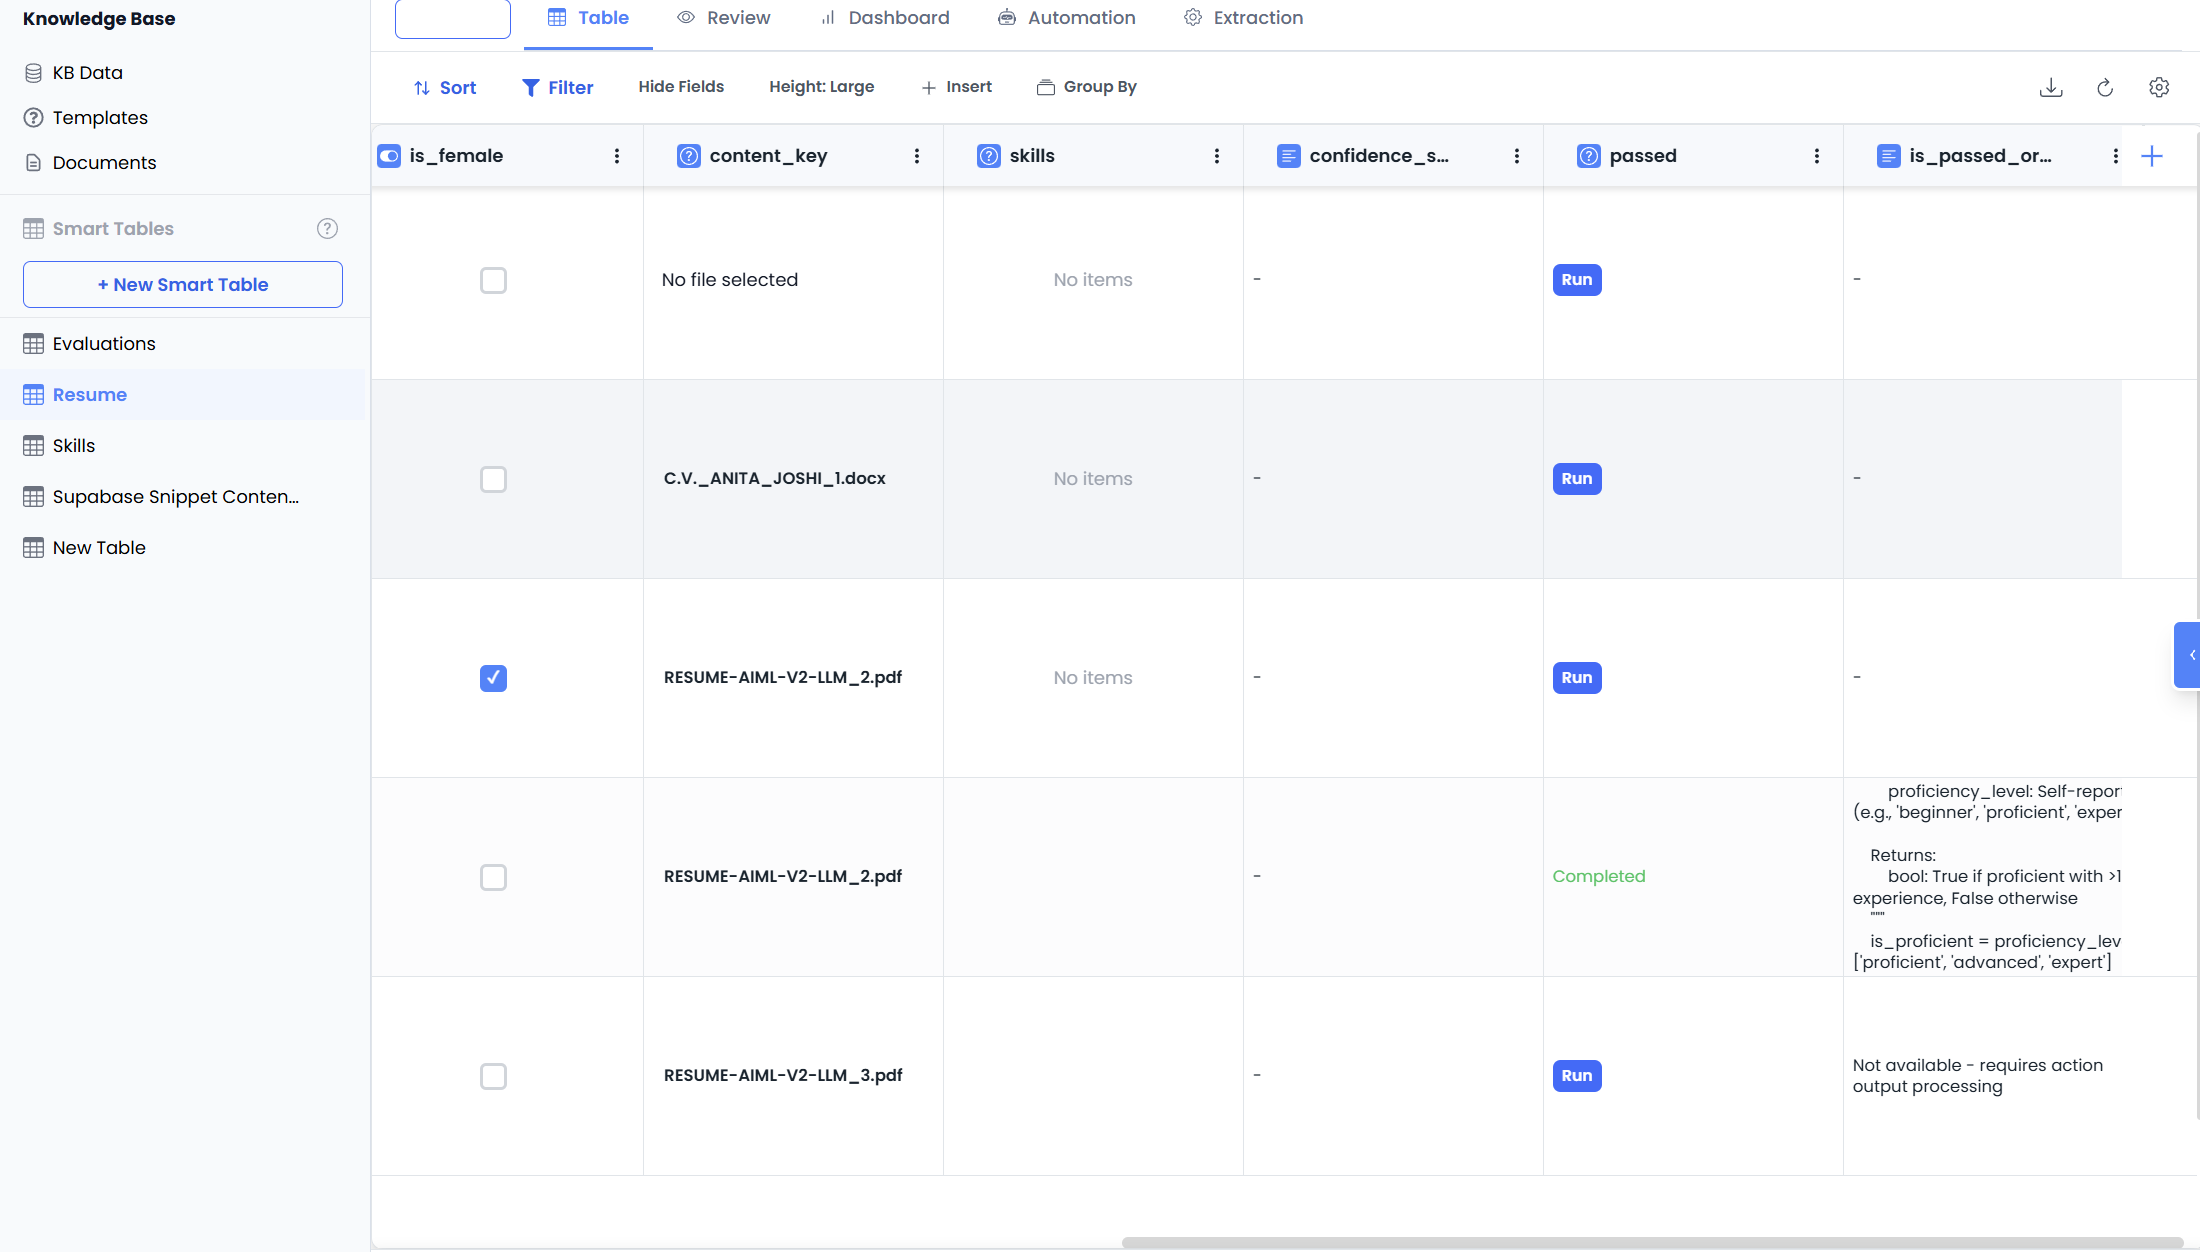
Smart Tables are accessed through the Knowledge Base (KB) section of the application. Once created, you can view and manage your Smart Tables by navigating to the KB Data section, where all tables are listed and can be opened for viewing or editing.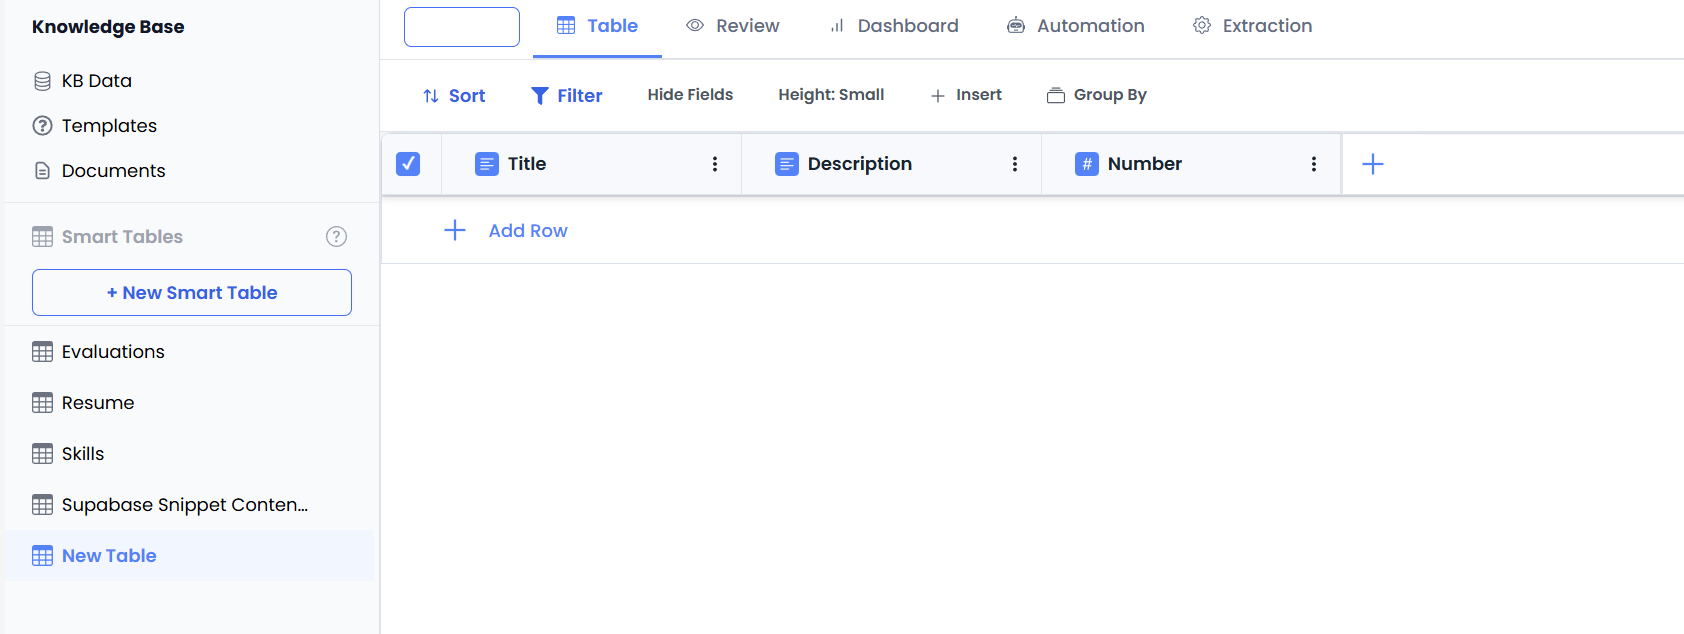
Creating Smart Tables
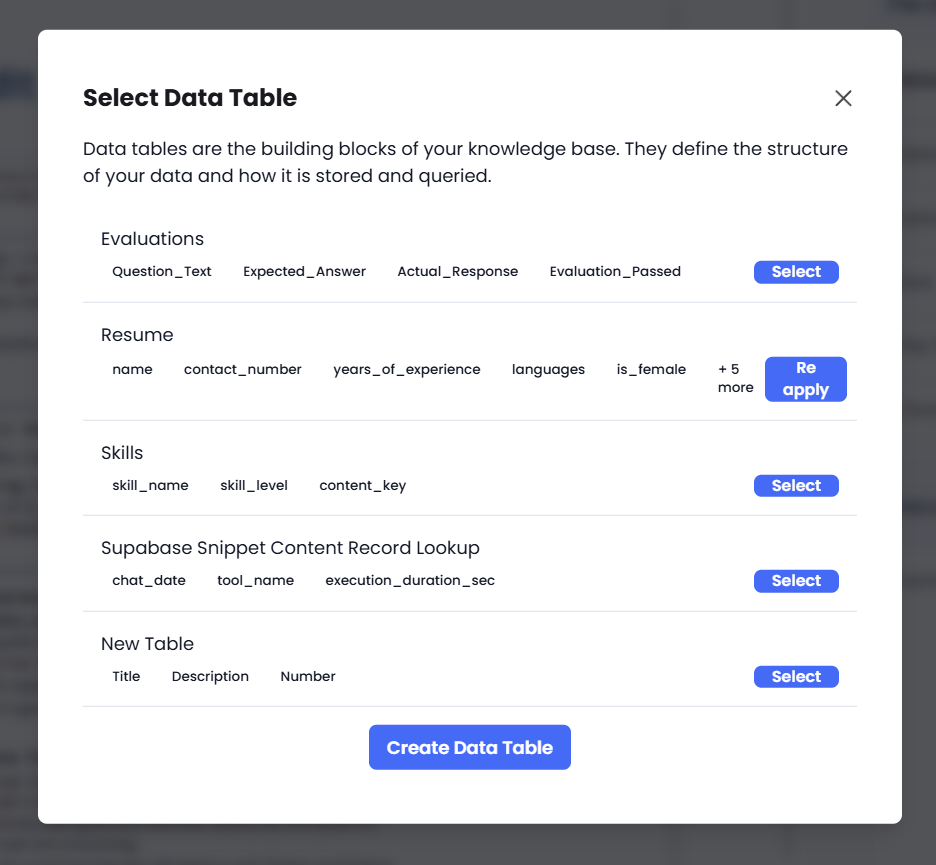
There are three primary methods to create a Smart Table within the Knowledge Base. Access these options by clicking the creation menu in the KB interface.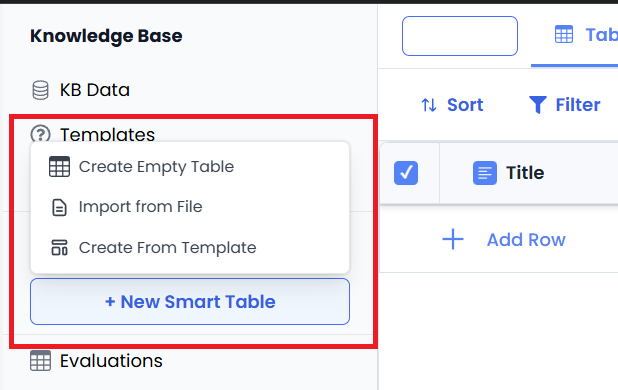
Method A: Create Empty Smart Table
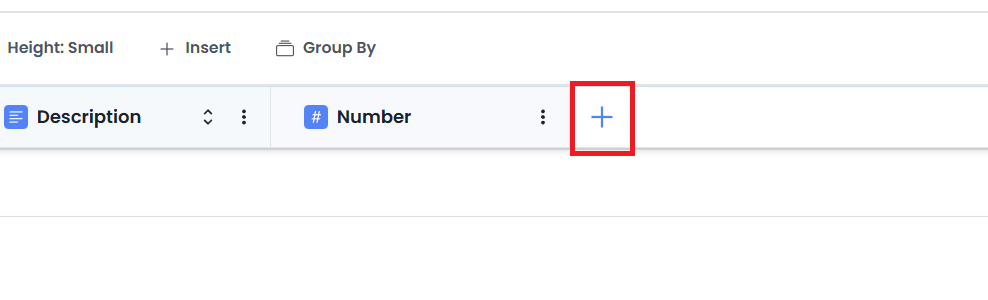
This option creates a blank table with default system columns (Title, Description, Number). A sidebar configuration panel opens automatically, allowing you to define your custom schema from scratch. You can keep these default fields, modify them, or delete them to create your own structure.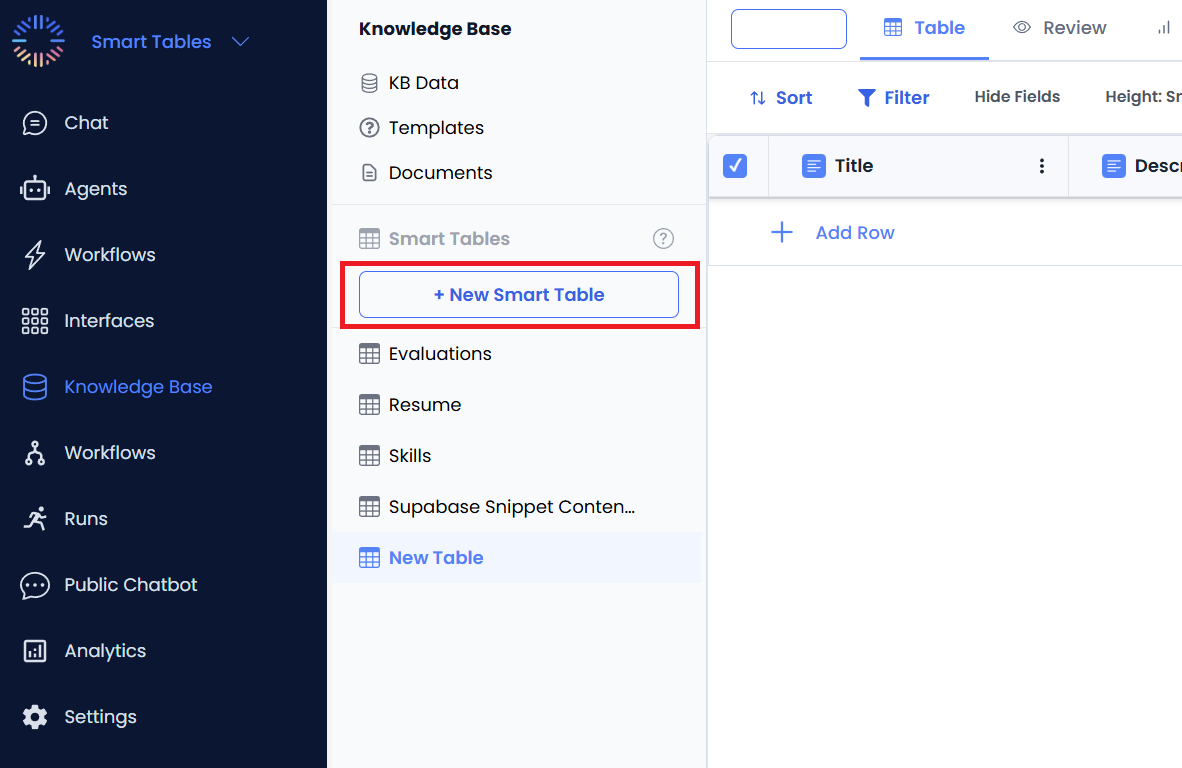
Method B: Create from Template
You can select from pre-defined templates to quickly set up tables for common use cases. Multiple templates are available for different scenarios. For example, the Evaluations Template imports a pre-defined set of columns designed for testing agent responses (Question Text, Expected Answer, Actual Response).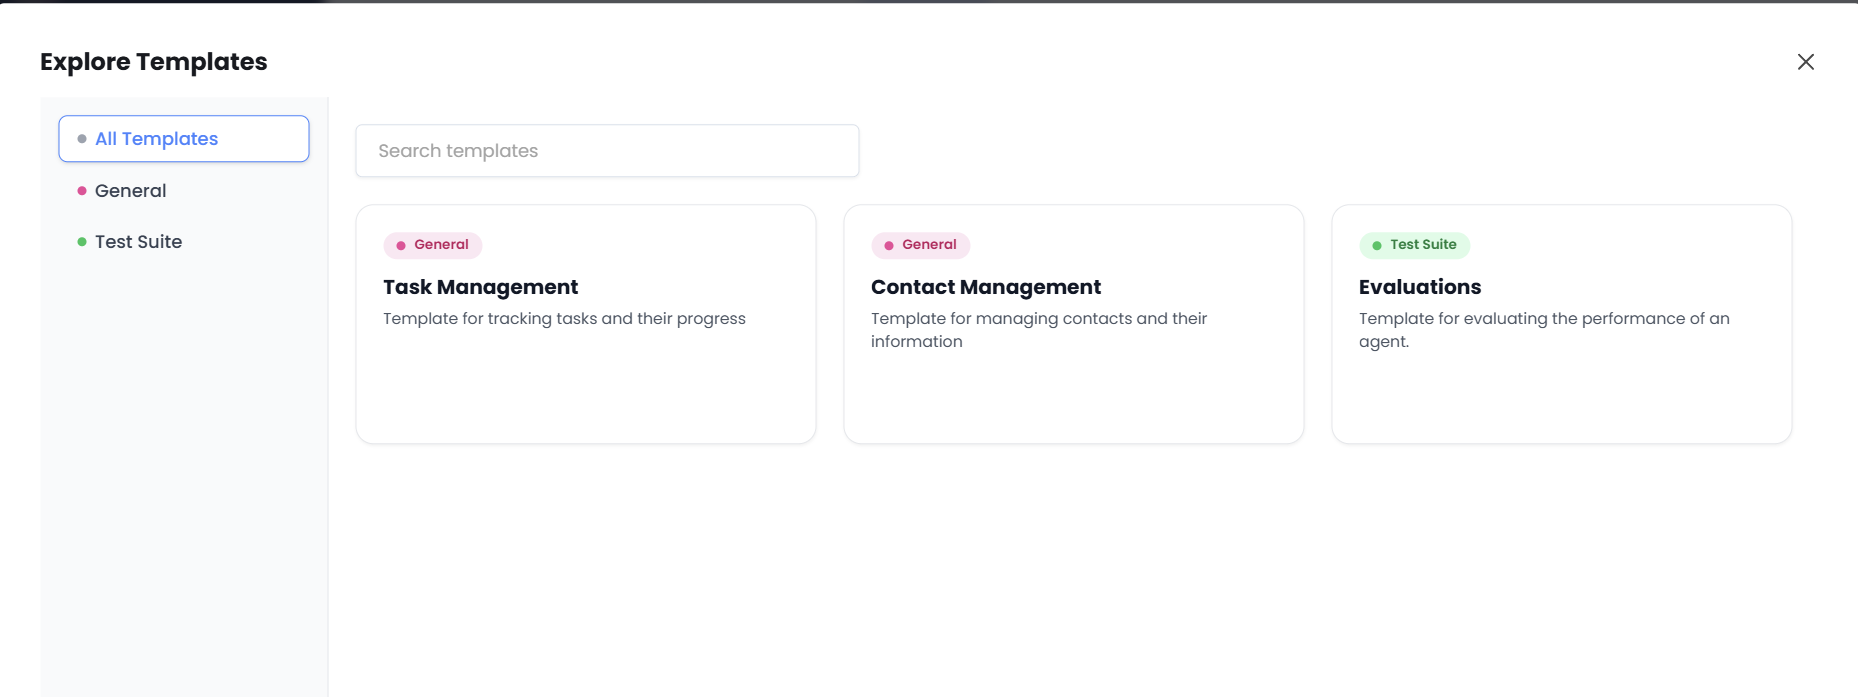
Method C: Import from File
You can upload a CSV file to automatically create a Smart Table. The system will parse the CSV headers to create columns and import the rows as data entries.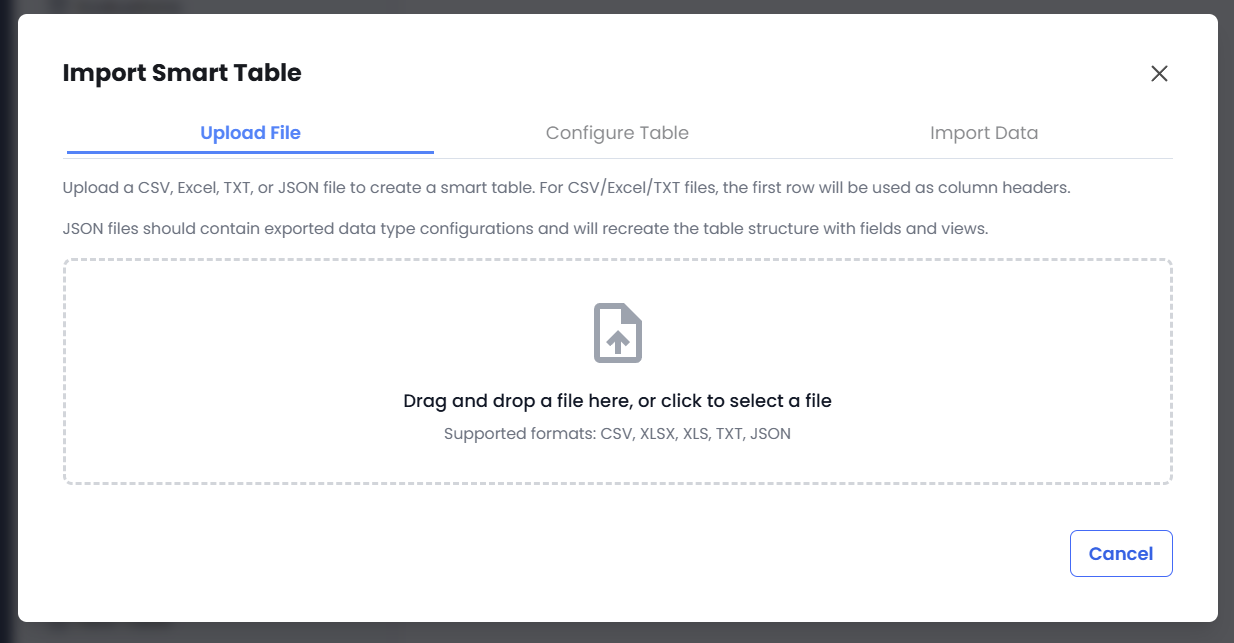
Column Types and Configuration
When configuring a Smart Table, each column requires specific definitions to ensure accurate data storage and extraction. A column consists of a Name, Type, Format, and Tool Source.Providing a clear Description for each column is critical. This description guides the Large Language Model (LLM) on what specific information to extract or generate for that field.
Configuring Columns
When creating or editing a Smart Table, use the sidebar panel to configure each column. After setting up a field’s properties (Name, Type, Format, Tool, and Description), click Save Field to apply the configuration. You can edit existing fields at any time by clicking on the field name in the column configuration panel, making changes, and saving again.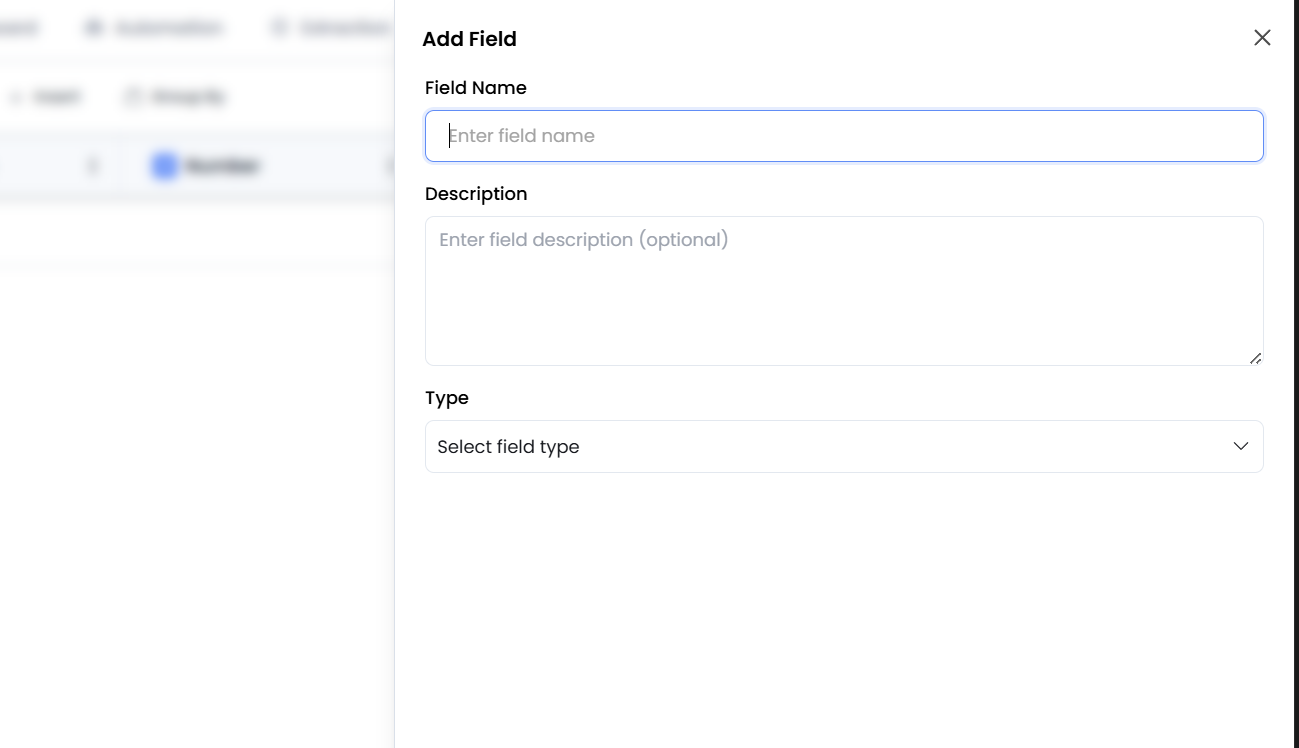
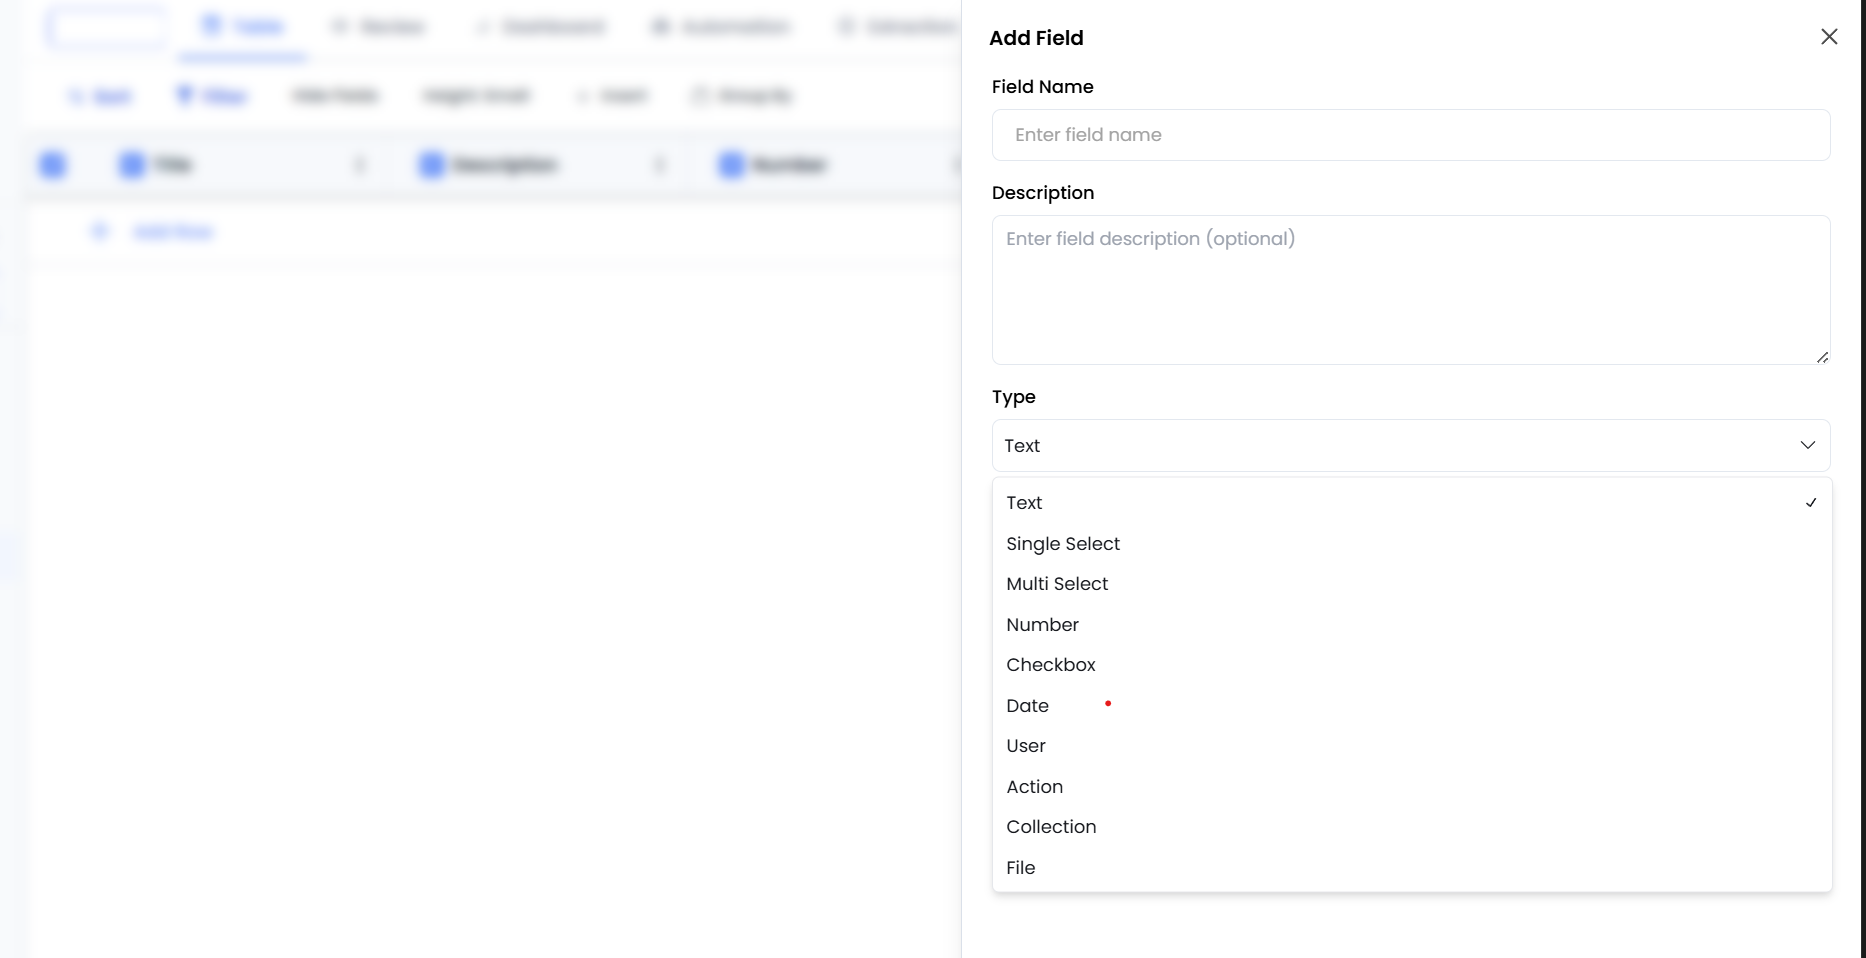
Field Types and Formats
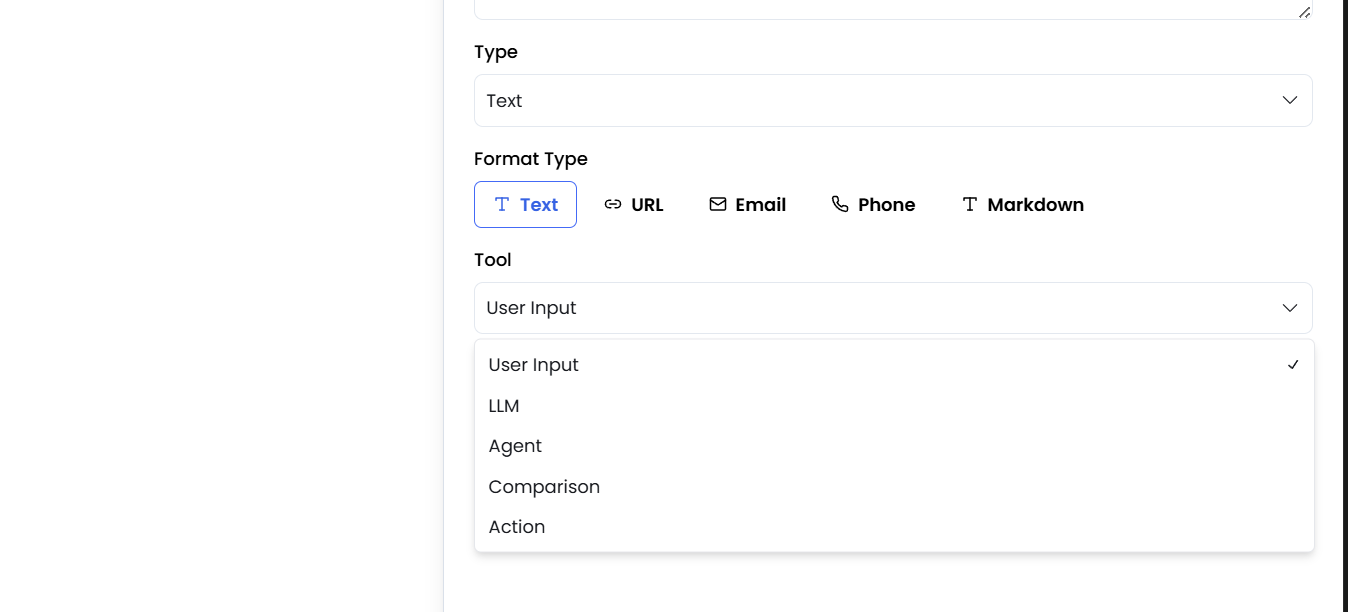
Tool Sources
The Tool setting defines how the data enters the cell:- User Input — Data is manually entered by the user or extracted directly from a file without modification
- LLM Generated — The AI model generates the content based on the column description and context (e.g., summarizing a resume)
- Agent Generated — An Agent processes a query and populates this field with the response
- Comparison — Compares two fields and determines if they match or calculates similarity scores
Data Extraction (Document Processing)
Smart Tables can automatically populate rows by extracting data from uploaded documents. This is particularly useful for processing standardized documents like resumes or forms. Each uploaded document creates one row in the Smart Table, though multiple documents can be uploaded and processed to create multiple rows in the same table.Workflow: Resume Extraction Example
-
Define Schema — Create a Smart Table named “Resumes” with columns:
- Name (Text)
- Contact Number (Text with Phone Number format)
- Years of Experience (Number with Decimal format)
- Languages (Multi-select with options: Python, Java, HTML, CSS)
- Is Female (Checkbox)
- Resume File (File)
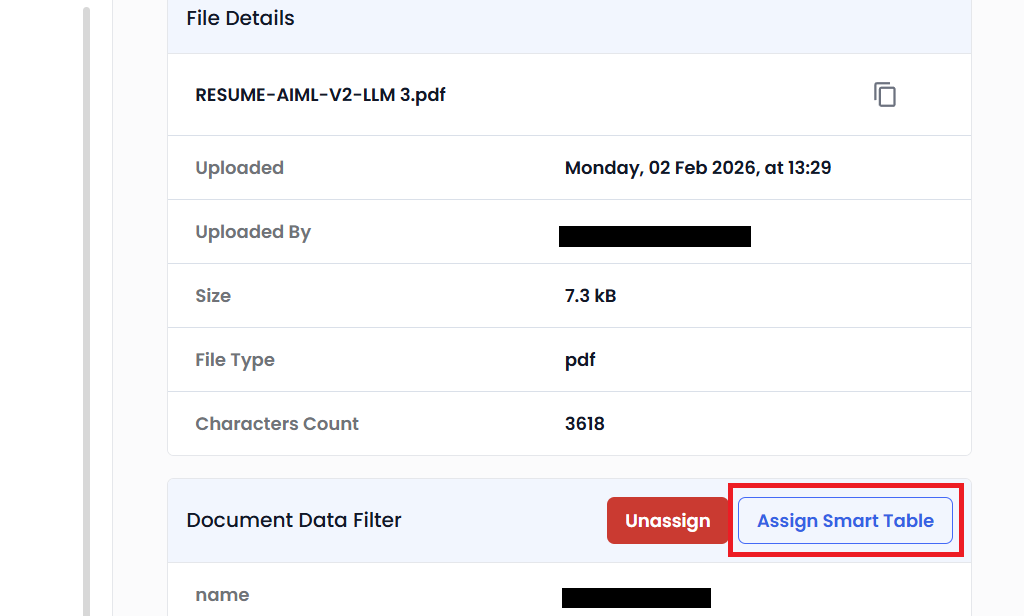
- Upload Document — Navigate to the Knowledge Base and upload a file (e.g., PDF Resume).
- Assign Smart Table — During upload, select the “Resumes” Smart Table.
- Extraction — The system processes the document and maps content to the defined columns (e.g., finding “3 years” in the text and populating Years of Experience, extracting phone numbers for Contact Number).
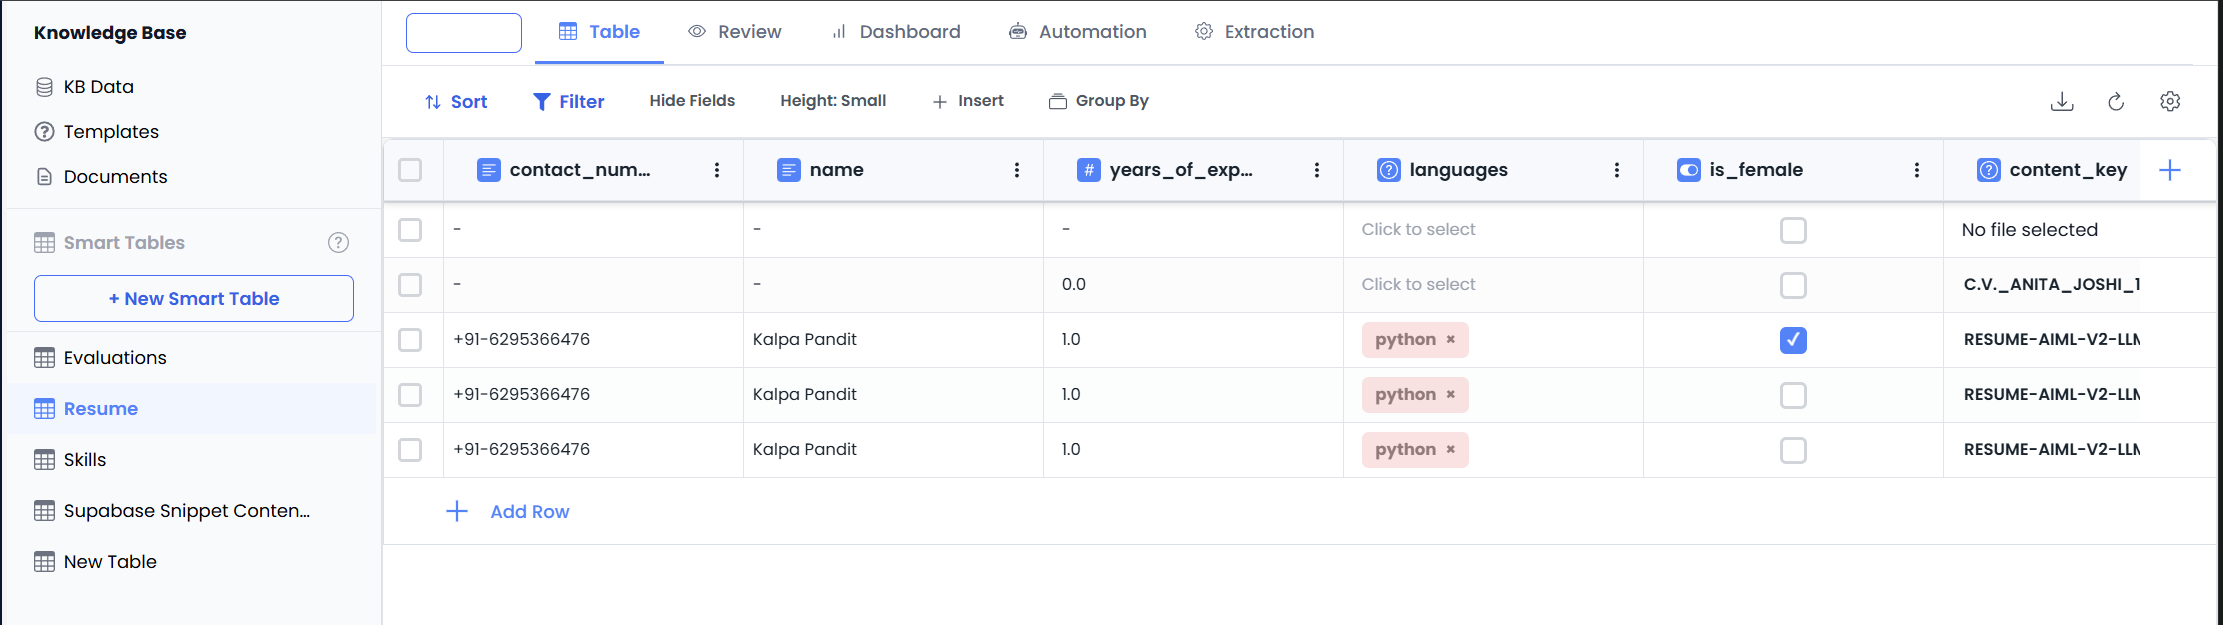
- Review Results — Navigate to the Smart Table to view the newly created row with extracted data.
Collections and Relationships
Collections allow for many-to-many mappings between Smart Tables. This is useful when a single row in a main table contains complex list data that requires its own structure.Example: Skills Mapping
Instead of storing skills as a simple comma-separated text string (e.g., “Python, Java”), you can create a relational structure with detailed skill information:-
Create “Skills” Table — Define columns:
- Skill Name (Text) — Name of the skill the user possesses
- Skill Level (Single Select) — Options: Beginner, Intermediate, Expert
- Configure Main Table — In the “Resumes” table, create a column named “Skills”.
- Set Type to Collection — Set the column type to Collection and link it to the “Skills” Smart Table.
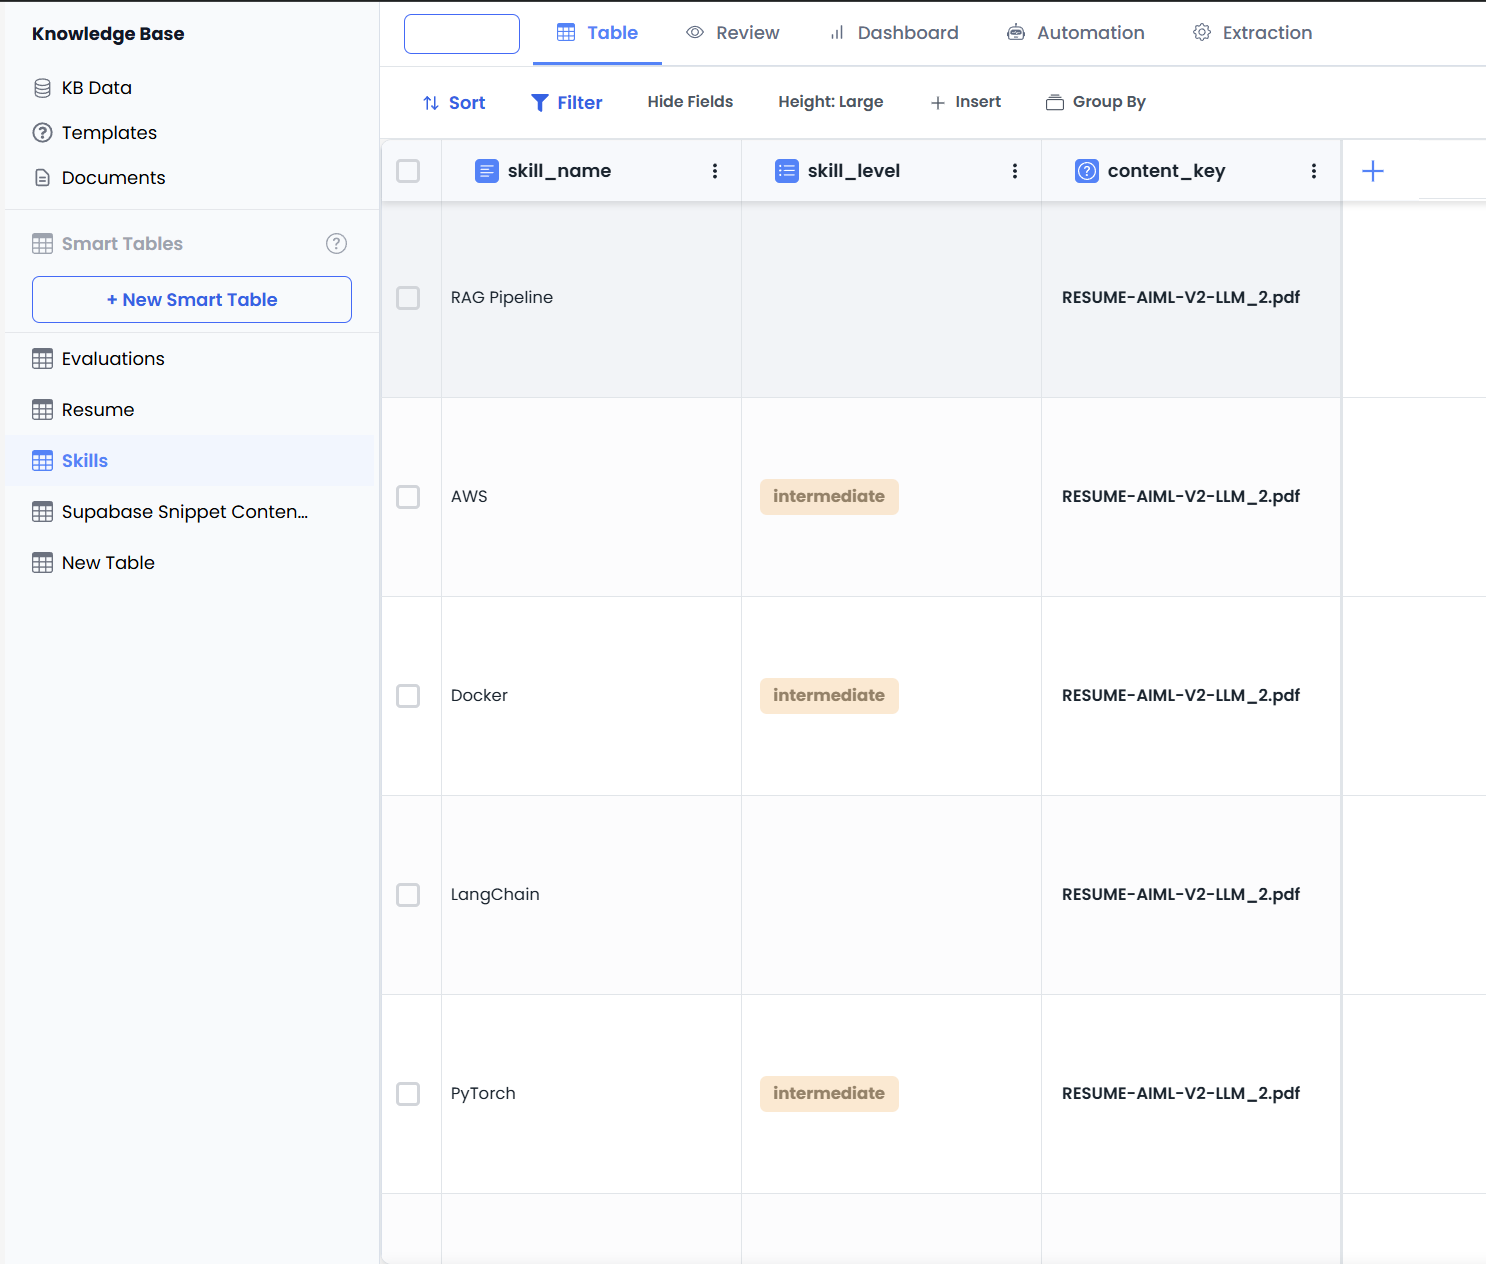
- Result — When a resume is processed, the system extracts skills and populates the “Skills” table with detailed rows (e.g., “Python - Expert”, “Java - Beginner”, “AWS - Intermediate”) that are linked back to the specific candidate via the many-to-many relationship.
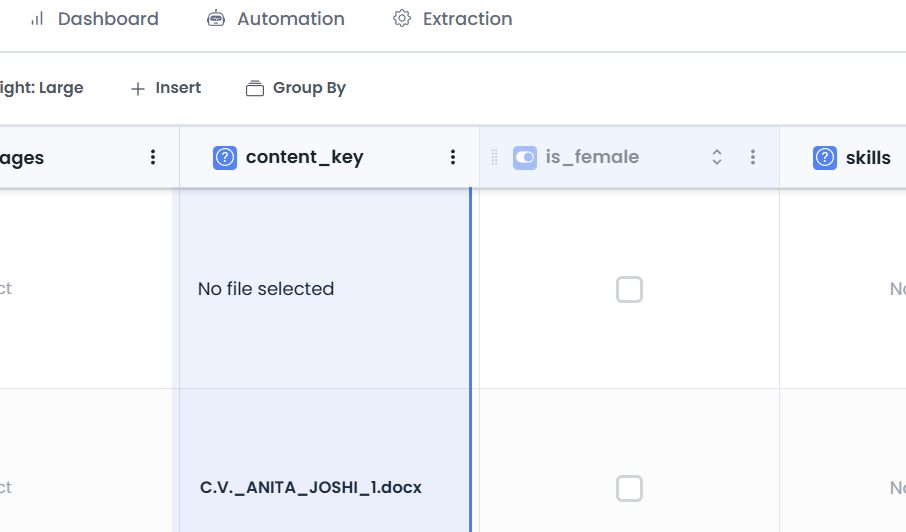
Viewing Collection Data
When viewing the main table (e.g., Resumes), the Collection field displays a link to the related entries. Clicking on this field navigates to the linked table (e.g., Skills) where you can see all the detailed skill entries for that candidate. The relationship is bidirectional—you can view which resume each skill belongs to by checking the Content Key in the Skills table.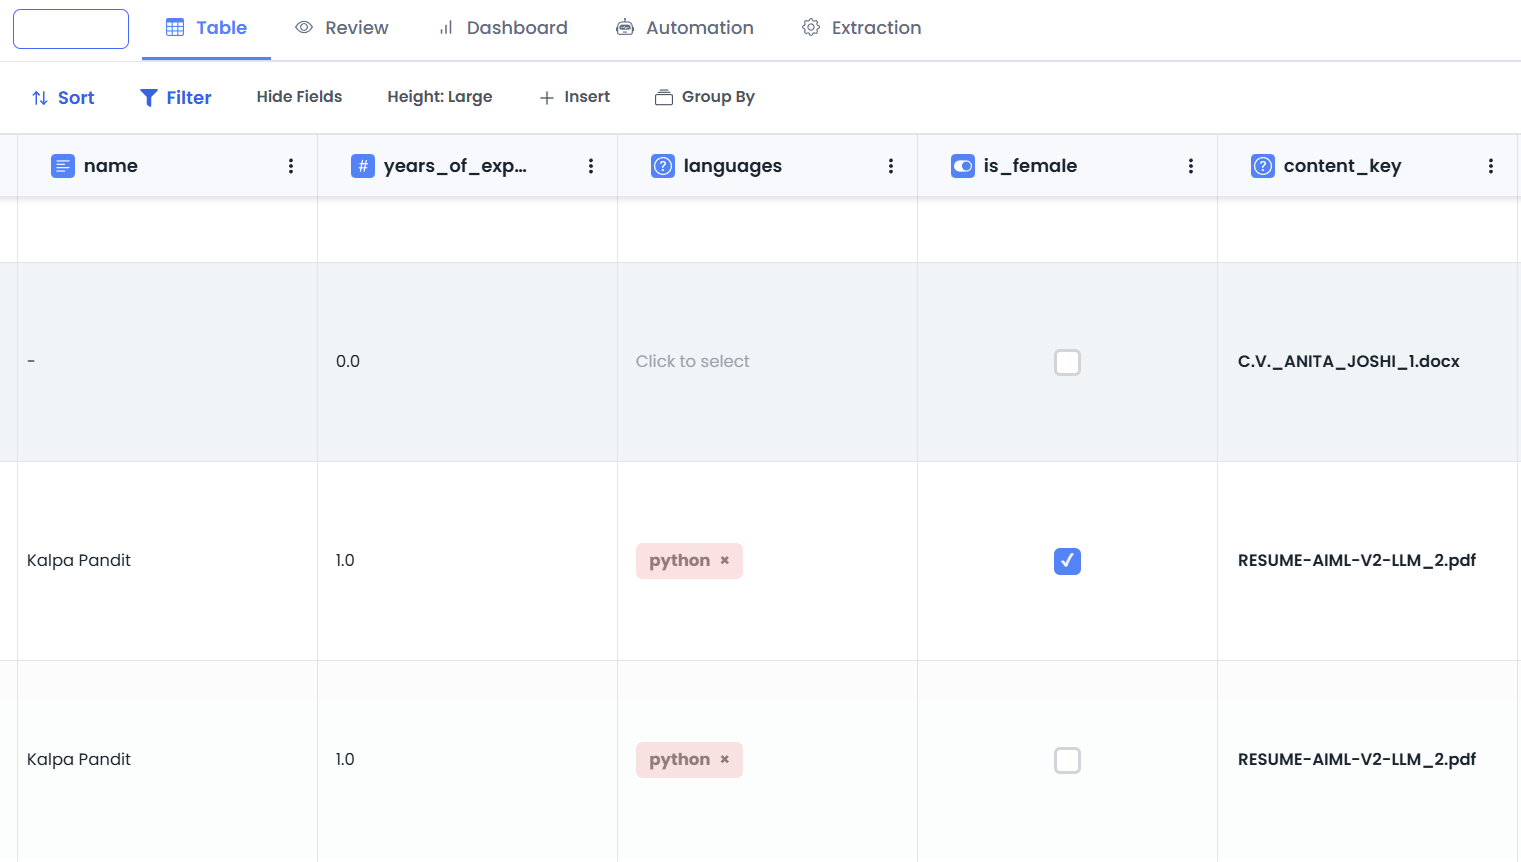
Data Management
Once data is populated, you have several tools to manage and organize the information.Views and Tabs
Smart Tables provide multiple views:- Table View — The default spreadsheet-like view for viewing and editing data rows and columns
- Dashboard View — A visualization view where you can create charts and widgets to analyze your data
Adding and Managing Rows
- Insert Row — Click Add Row or Insert Row to manually add a new blank row
- Automatic Row Creation — When a document is uploaded and assigned to a Smart Table, a new row is automatically created and populated with extracted data
Editing and Re-computing
- Manual Edit — Click any cell to manually update the value
- Execute Cell/Row — For rows with LLM-generated or Agent-generated fields, click Execute Cell or Execute Row to compute or refresh just that row’s data
- Re-compute All — To refresh all rows in the Smart Table simultaneously, use Re-compute All. This is useful when you’ve updated column descriptions or agent configurations and want to re-process the entire dataset
Grouping and Organizing
You can group data by specific columns to organize the view. For example, grouping a candidate list by the “Language” multi-select field allows you to see all Python developers grouped together. Columns can also be rearranged by dragging and repositioning them in the table view.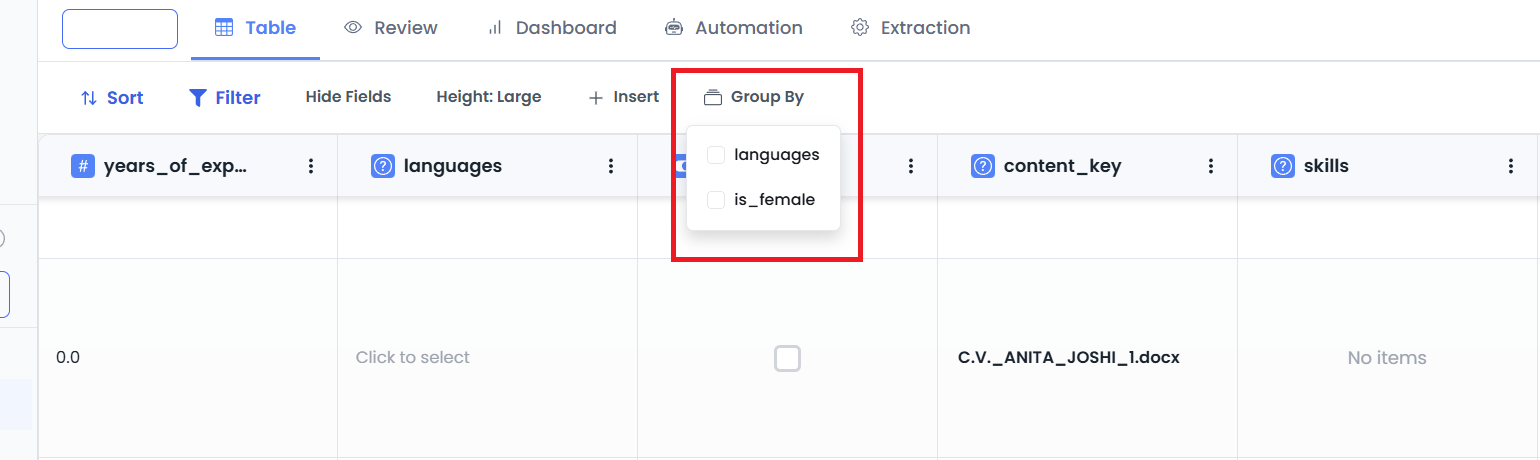
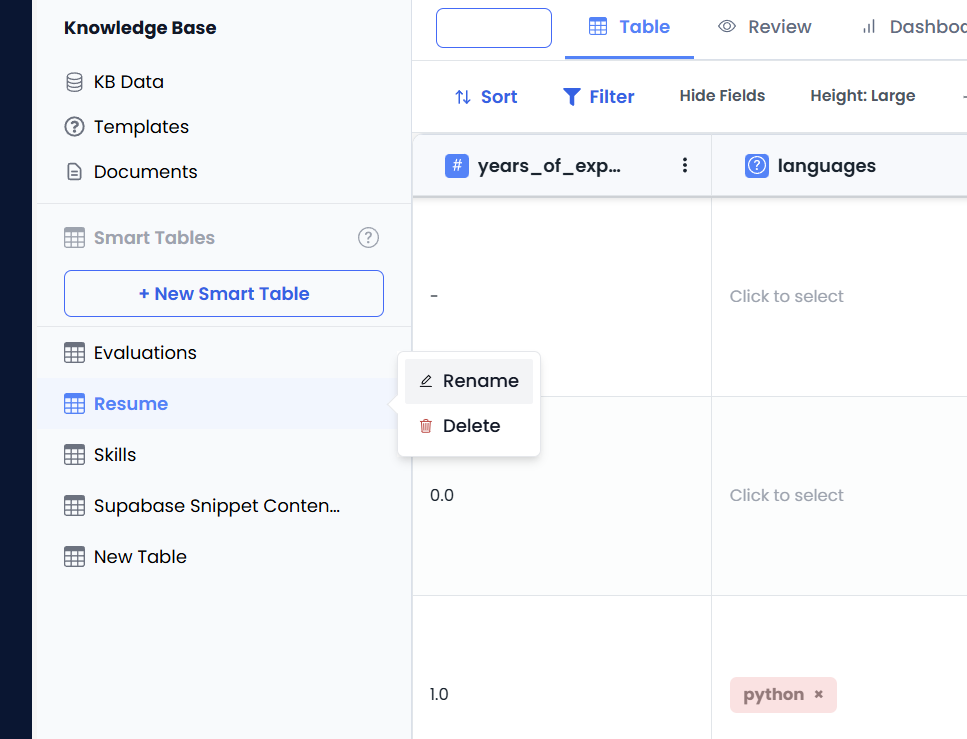
Renaming Smart Tables
To rename a Smart Table, click on the table name at the top and enter a new name. This helps organize multiple tables with descriptive identifiers (e.g., “Resumes”, “Skills”, “Evaluations”).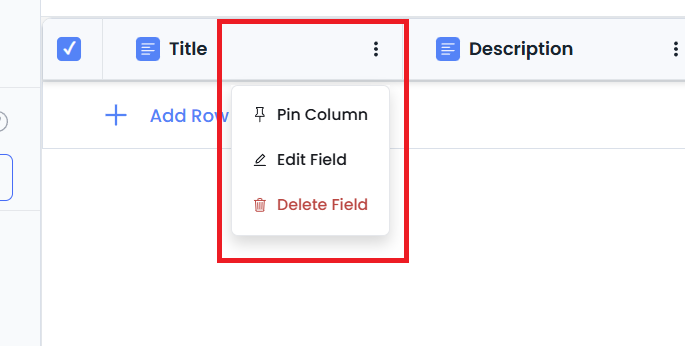
Deleting Fields and Rows
- Delete Column — When editing a column configuration, select Delete Field to remove the column entirely
- Delete Row — Click on a row and select Delete to remove individual entries
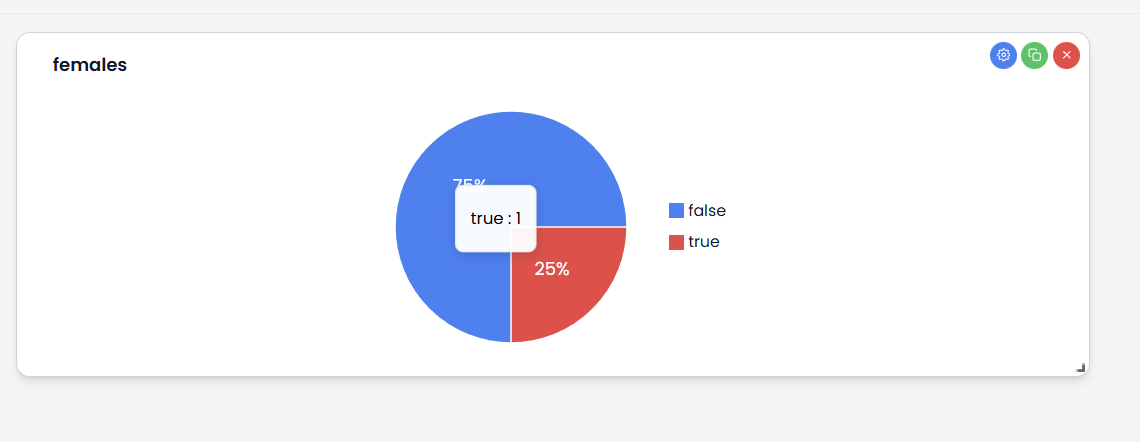
Dashboards and Visualization
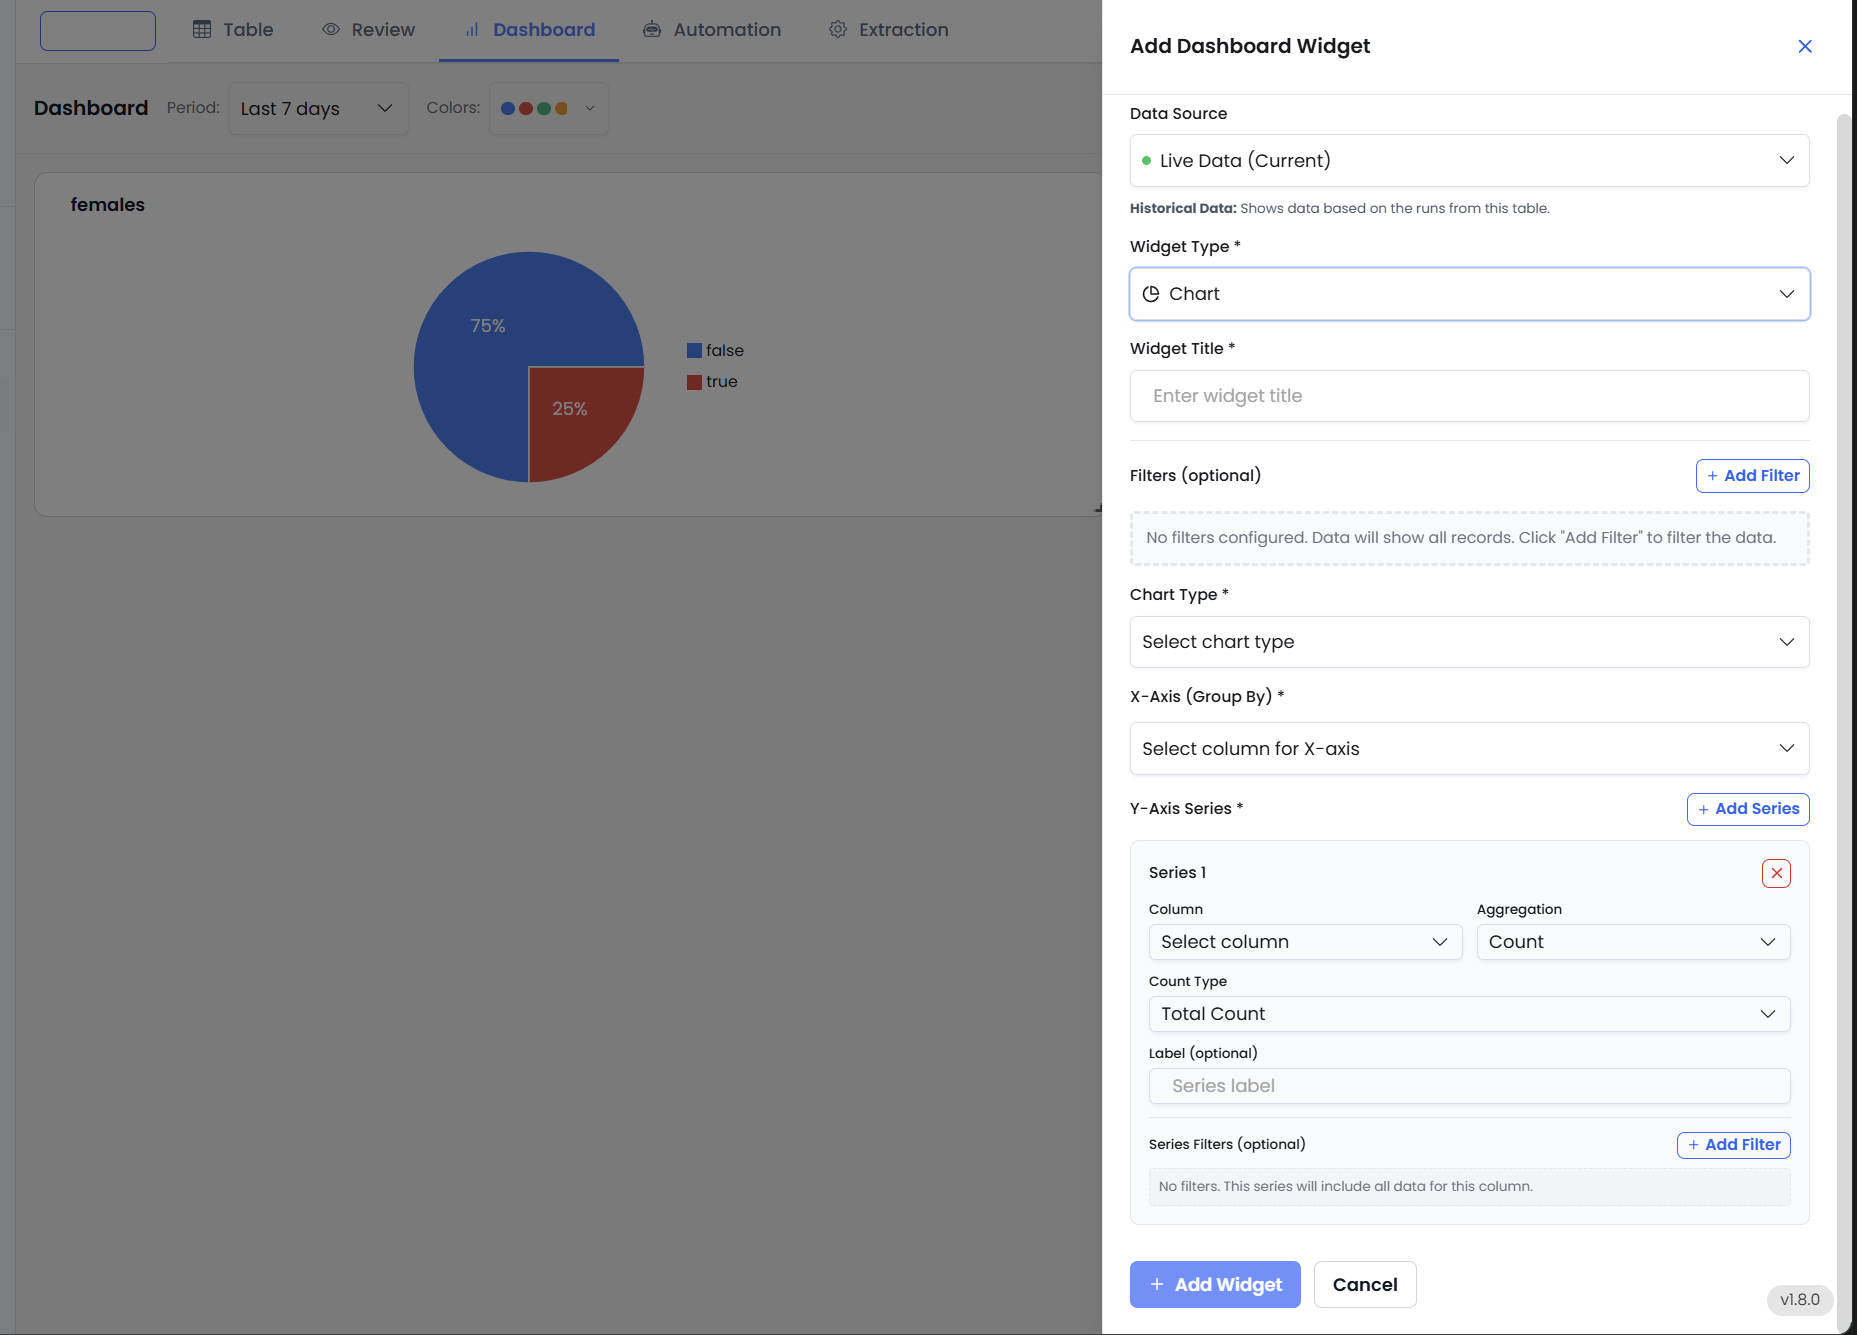
Smart Tables include a built-in Dashboard view to visualize the stored data.Creating Widgets
- Navigate to the Dashboard tab within the Smart Table
- Click Add Widget
- Configure Chart:
- Widget Title — Provide a descriptive title (e.g., “Total Candidates by Gender”)
- Chart Type — Select from Pie Chart, Bar Chart, Line Chart, and others
- X-Axis (Category) — Select the grouping field (e.g., Is Female)
- Y-Axis (Value) — Select the metric to measure. You can choose aggregation functions like Count, Sum, Average, or other statistical measures
- Y-Series Column Name — Optionally customize the label for the data series shown in the chart legend
- Save the widget to add it to the dashboard
Querying Smart Tables via Agents
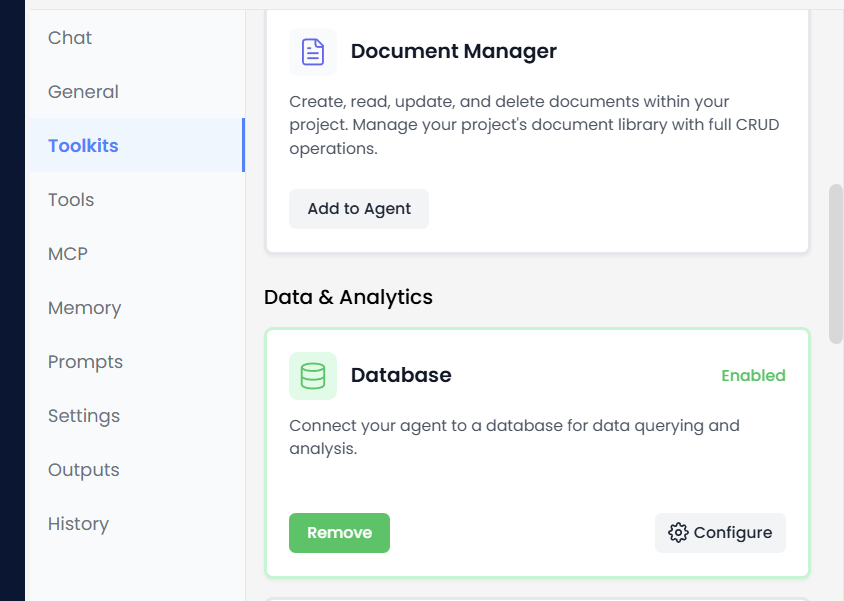
One of the most powerful features of Smart Tables is the ability to query the structured data using natural language through an Agent.Setup Process
- Create Agent — Go to the Agent builder
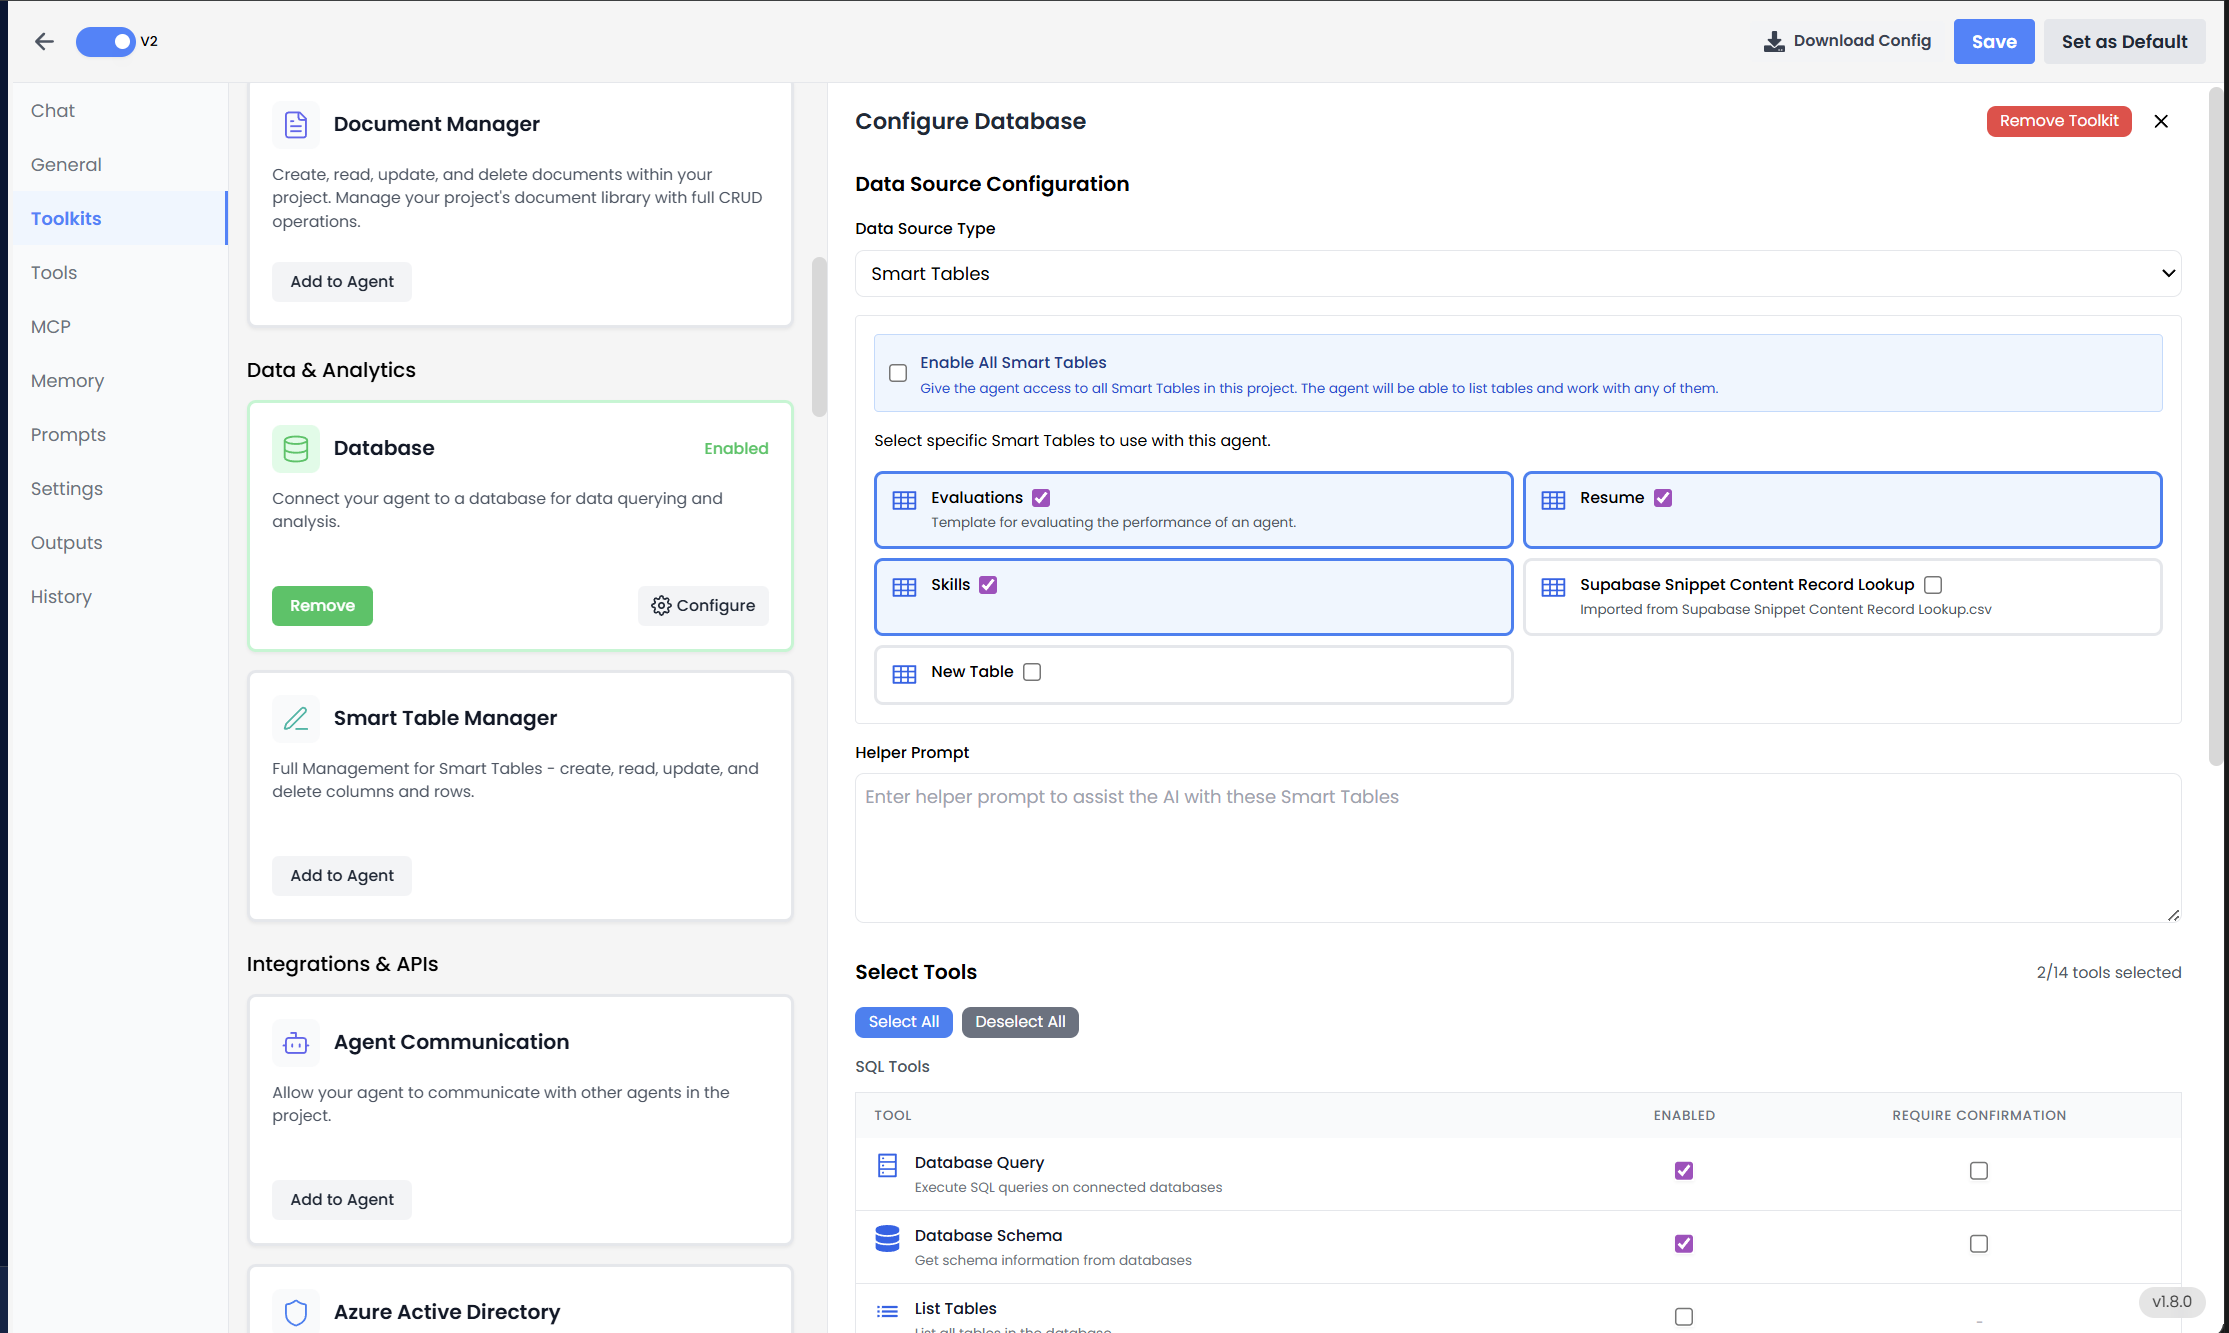
- Configure Toolkits — Add the Database Manager toolkit to the agent
- Select Smart Tables — In the toolkit settings, select one or multiple Smart Tables that the agent should have access to. This allows the agent to query across multiple related tables simultaneously
- Configure Query Options — In the Database Manager settings, deselect unnecessary options like “Database Query” or “Database Schema” if you only want the agent to access Smart Table data specifically
- Save and Test — Open the agent chat and ask questions using natural language, for example:
- “How many candidates have more than 5 years of experience?”
- “List all Python experts”
- “How many rows are there in the Resumes table?”

Templates
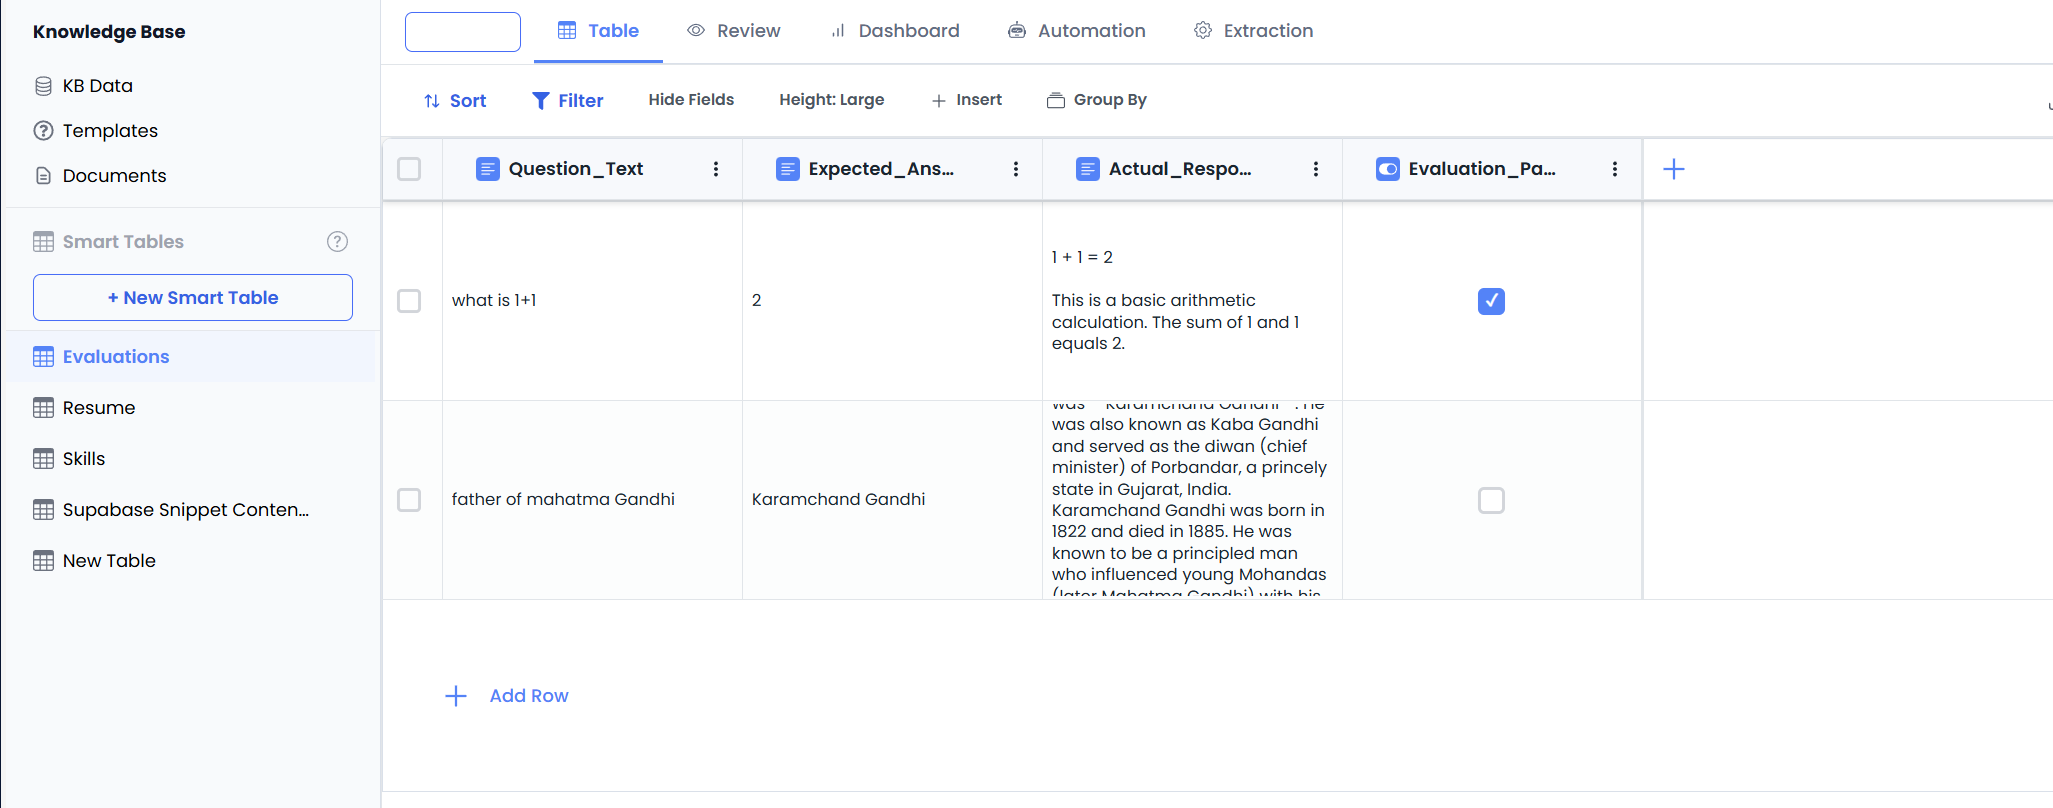
Templates accelerate the setup of complex tables by providing pre-configured column structures for common use cases. You can select from existing templates but cannot create custom templates through the UI.Evaluation Template
This template is designed for testing Agent performance and validating AI responses. It includes:- Question Text — The input prompt for the agent (User Input field)
- Expected Answer — The ground truth or correct answer (User Input field)
- Actual Response — A field populated by the agent during the evaluation run (Agent Generated field)
- Evaluation Status — A comparison/correction field determining if the Actual Response matches the Expected Answer (returns pass/fail percentage)
- Create a Smart Table from the Evaluations Template
- Add rows with your test questions and expected answers
- Configure the Agent field to connect to your AI agent
- Execute individual rows or run Re-compute All to test all questions
- Review the Actual Response and Evaluation Status to assess agent performance
Best Practices
- Column Descriptions — Always write clear, descriptive text for columns to guide the LLM during data extraction. For example, instead of just naming a column “Exp”, name it “Years of Experience” and add a description: “Total years of professional work experience found in the resume.”
- Data Types — Use specific data types (Number vs Text) to enable accurate sorting, filtering, and chart creation in Dashboards. Use Number type for “Years of Experience” rather than Text.
- Format Selection — Choose appropriate formats for each field type. For phone numbers, use the Phone Number format under Text type. For monetary values, use Currency format under Number type.
- Collections — Use Collections for complex lists (like Skills, Certifications, or Education History) to maintain data integrity and allow for deeper analysis. This prevents data duplication and enables better querying.
- Testing — When setting up extraction, test with one or two documents first to verify that the column descriptions are guiding the AI correctly before bulk uploading multiple documents.
- Quick Upload — Enable Quick Upload when uploading documents with Smart Table assignment to immediately extract and populate data without additional manual steps.
- Re-apply Extraction — If you modify column definitions or descriptions, you can re-assign the Smart Table to existing documents to re-extract data with the updated configuration.
- Comparison Fields — Use Comparison for validation scenarios, such as comparing expected vs actual results in testing or quality assurance workflows.
Smart Tables can also trigger and interact with Workflows (Actions). This allows for advanced logic, such as “If Resume Qualifies, send email.” Detailed documentation on configuring Workflows and Actions is covered in the separate Workflow Automation Documentation.