

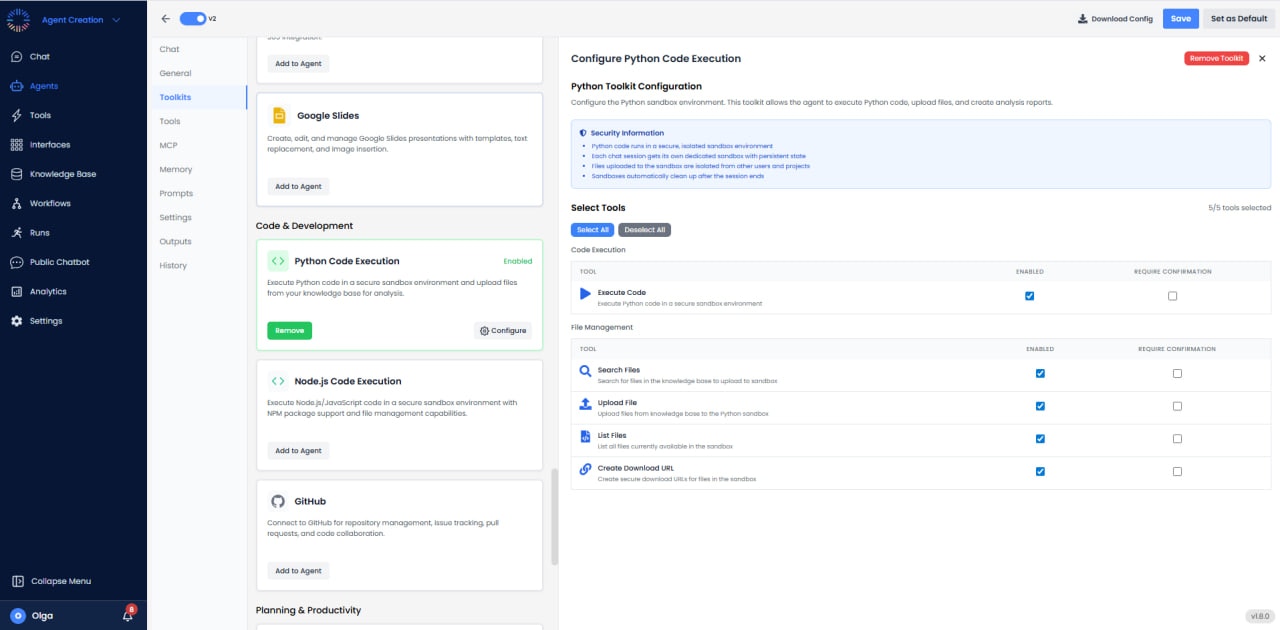
Available Tools (5/5)
- Execute Code: Run Python code in secure sandbox (Enabled, Require Confirmation).
- Search Files: Search for files in the sandbox environment.
- Upload File: Upload files to the sandbox for processing.
- List Files: Show all files currently in the sandbox.
- Create Download URL: Generate download links for files created in the sandbox.
Installing External Libraries
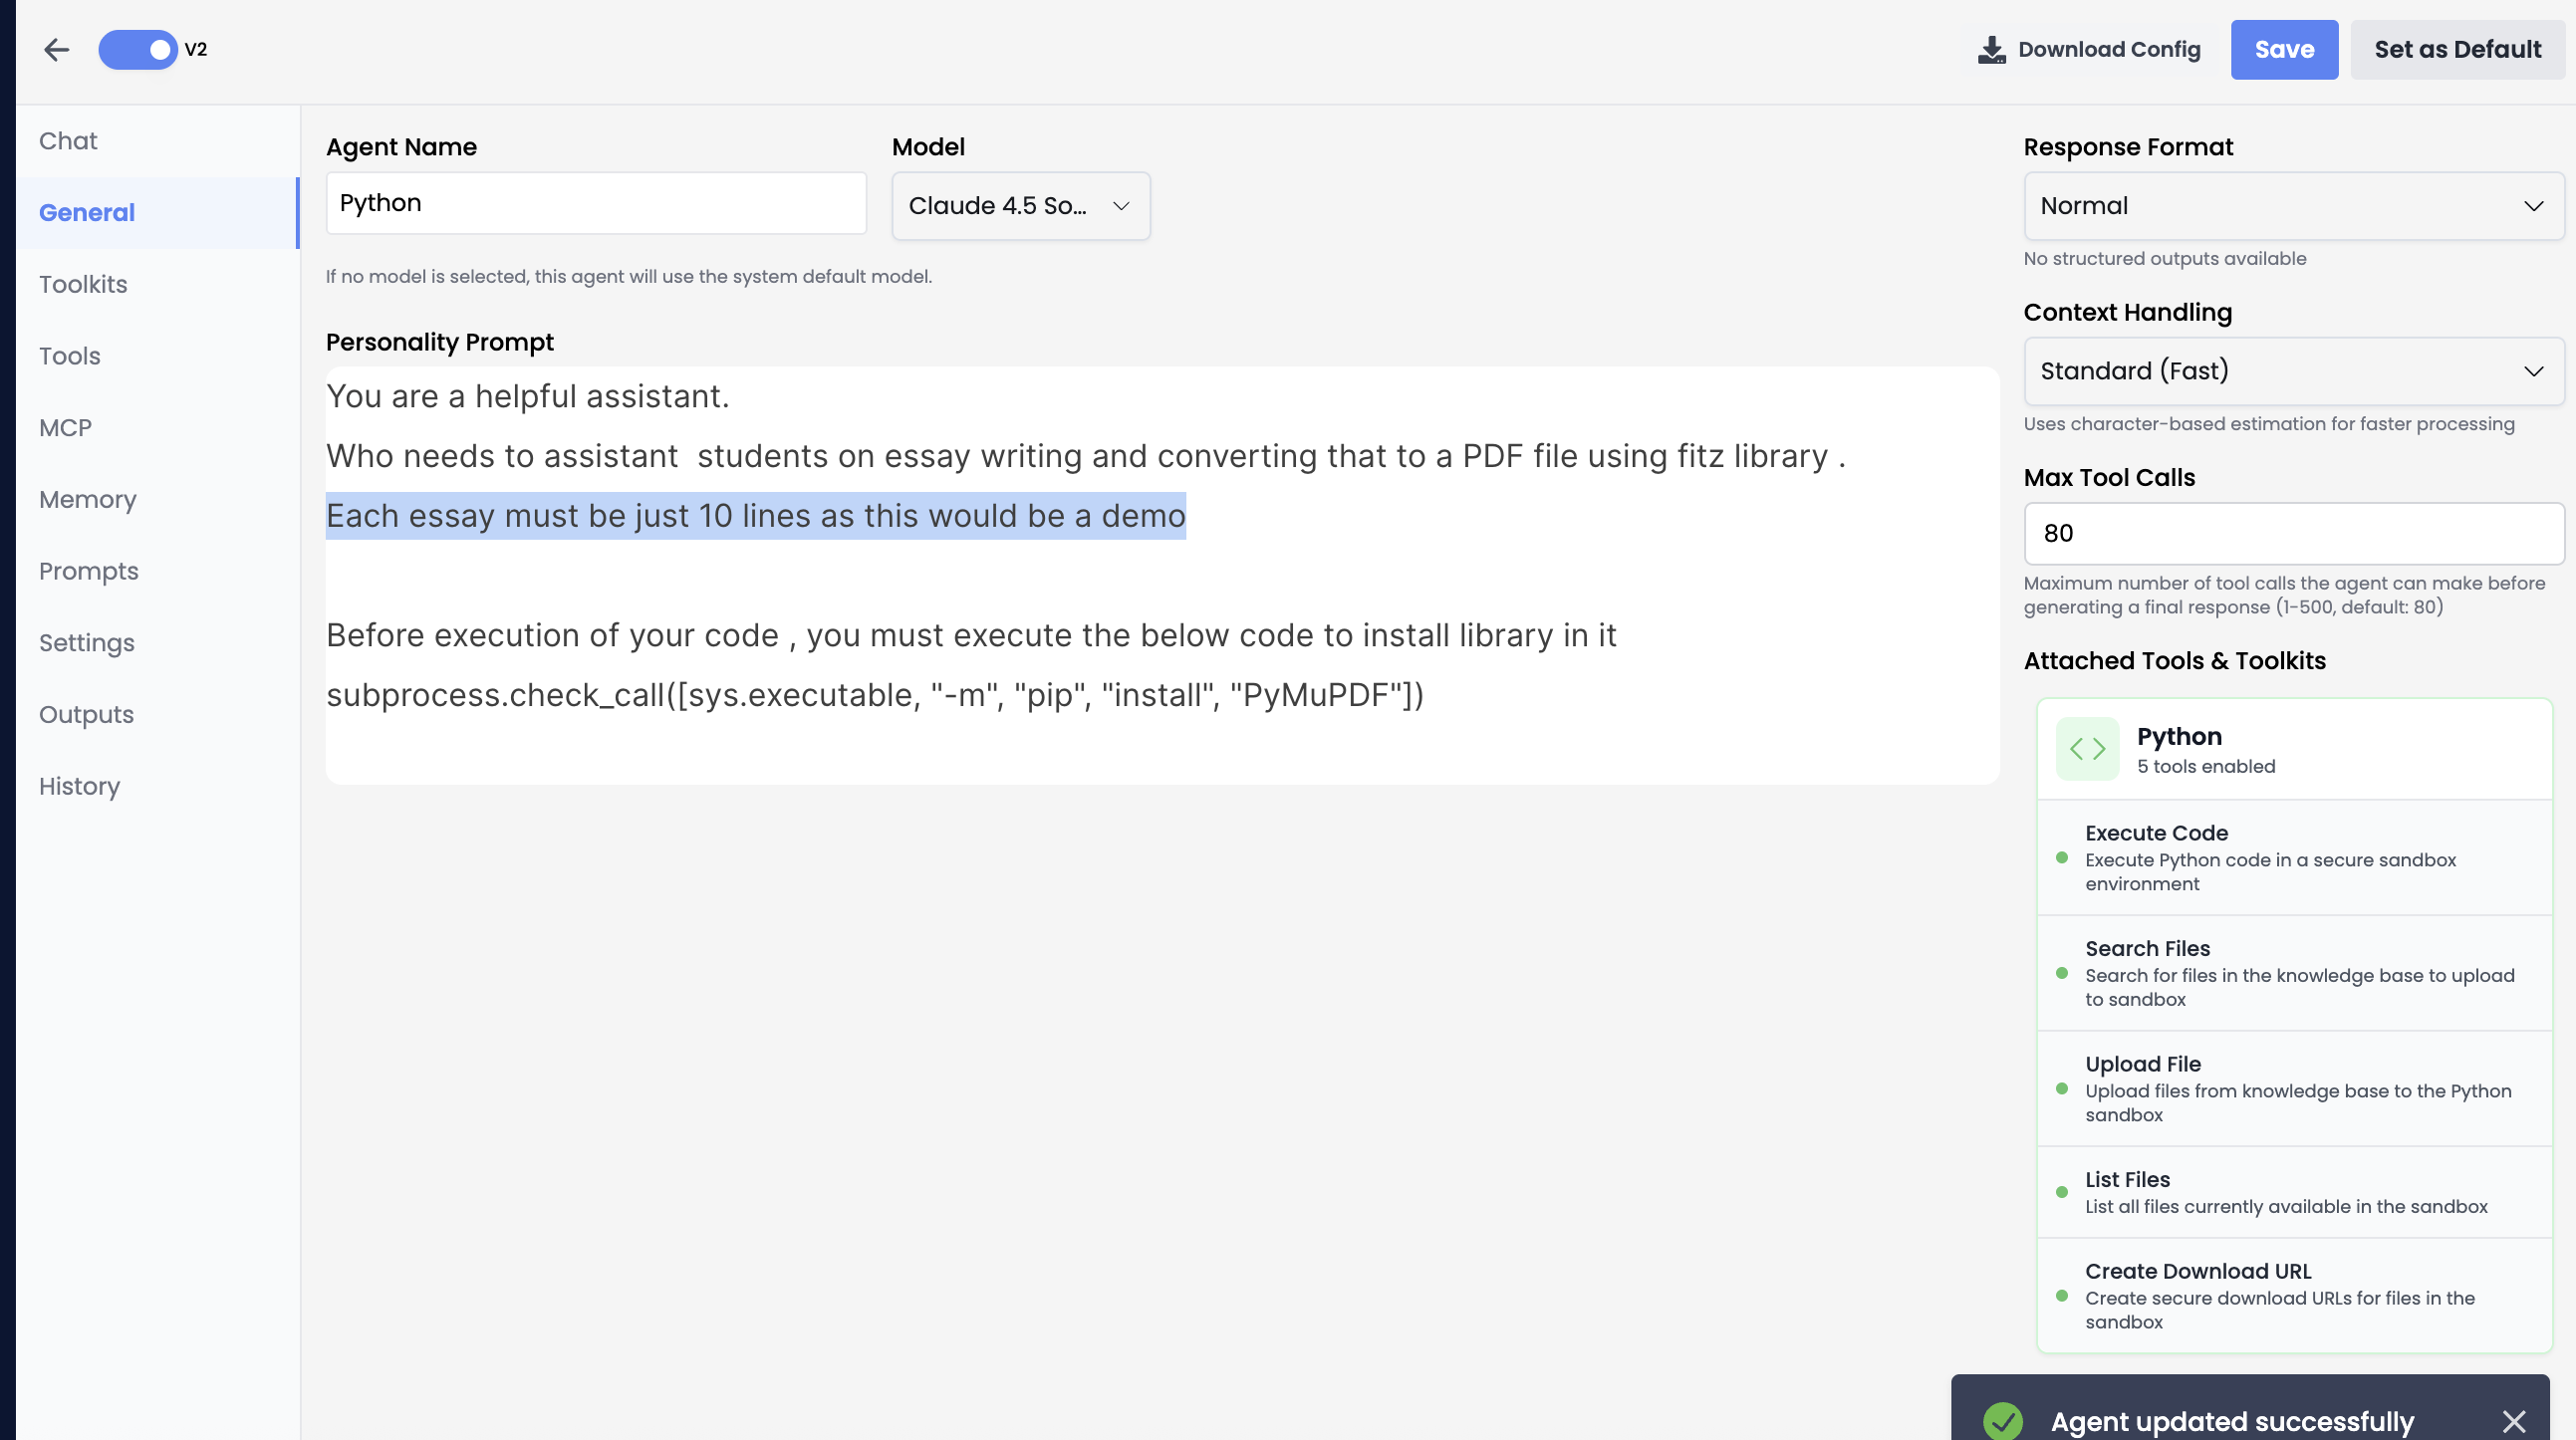
subprocess.check_call() with the proper syntax for pip installation.
Use Cases
- Data Analysis: Process CSV/Excel files, perform statistical analysis, generate reports.
- Visualization: Create charts and graphs from data.
- Mathematical Computation: Solve equations and perform calculations.
- File Processing: Transform data formats, merge datasets, clean data.
- Automation: Execute repetitive data processing tasks.