

- Understand what’s happening across the system
- Spot any issues before they affect users
- Improve system performance by identifying slow or failing processes
Dashboard View
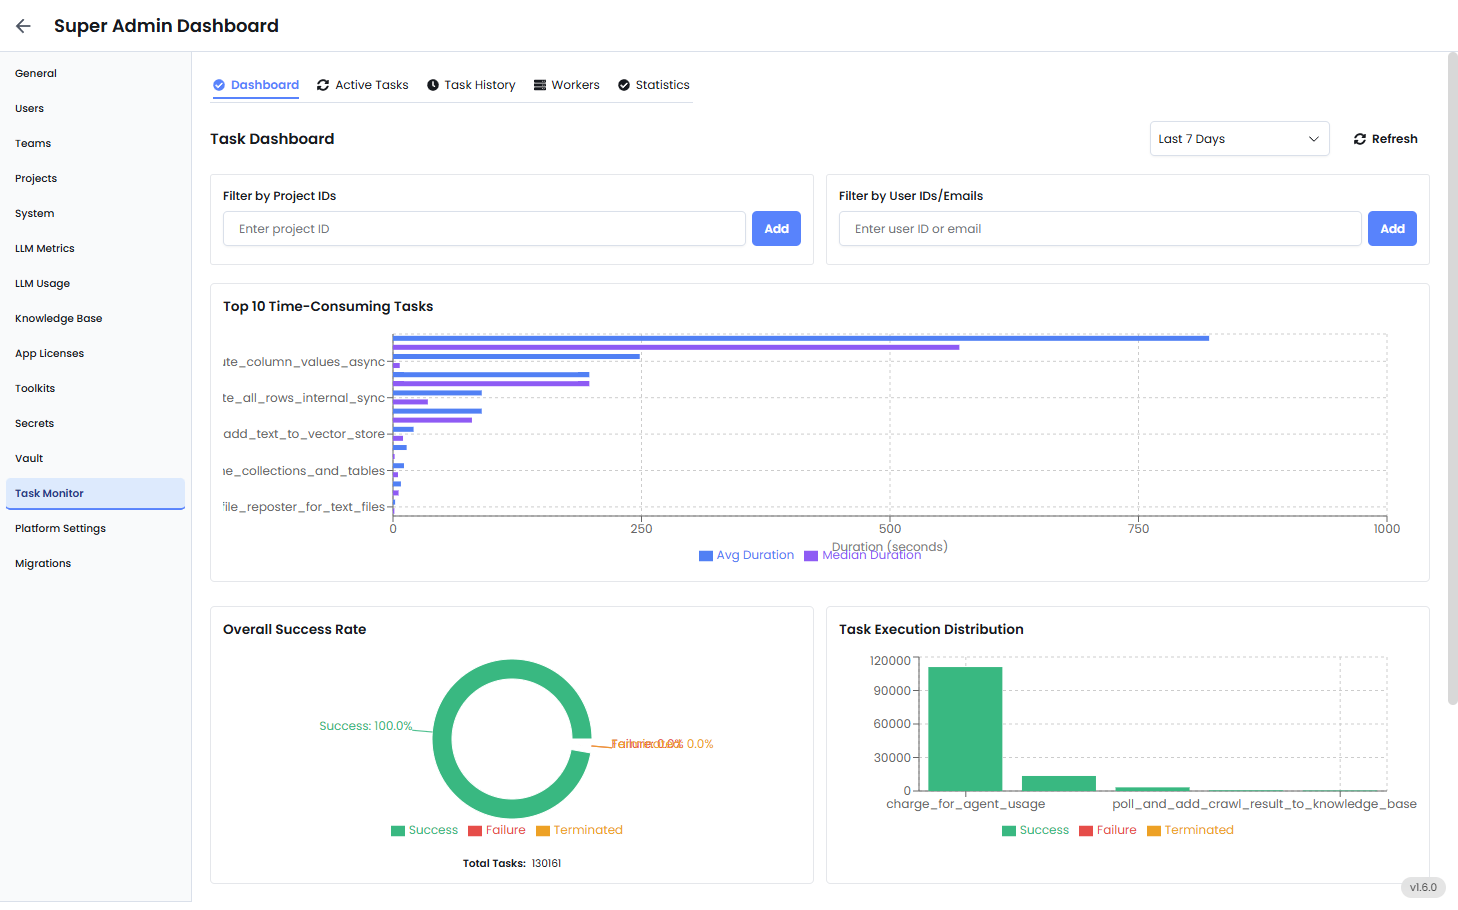
Filters (Top Panel)
Use filters to get results based on:- Project ID: Isolate task activity from a specific team or initiative.
- User ID or Email: Audit or troubleshoot tasks run by a specific user.
- Date Range: Defaults to the last 7 days, but can be adjusted.
- Refresh Button: Pulls in the latest data from the task execution logs.
Top 10 Time-Consuming Tasks
This bar chart lists the tasks that are taking the most time to execute, based on system records.- Avg Duration (Blue Bar): The average time this task takes across all executions.
- Median Duration (Purple Bar): The middle value — helps you spot if a few slow tasks are skewing the average.
- Which tasks are the most resource-intensive?
- Are there outliers (e.g., one task spiking to 3x normal time)?
- Should you optimize, reschedule, or break apart any specific logic?
Overall Success Rate (Donut Chart)
This chart shows the health of your system in terms of task outcomes:- Success – The task completed without errors.
- Failure – The task encountered an error (e.g., API failure, timeout, bad data).
- Terminated – The task was forcefully stopped before completion, either manually or by system limits.
Task Execution Distribution
This chart shows how often each task runs, and how often it succeeds or fails. For each task:- Green bars = Successful runs
- Red bars = Failures
- Orange bars = Terminated runs
- Which tasks are used most frequently?
- Are there tasks that run often but frequently fail?
- Are critical workflows being disrupted by repeated failures?
Task Duration Range
This graph breaks down how long each task is taking, over time. For each task, it plots:- Average Duration
- Median Duration
- Max Duration
- Min Duration
- Backend slowdowns
- Input anomalies
- Rate-limiting from third-party APIs
What Admins Should Do Regularly
Example Admin Use Case
Suppose a team reports that “document ingestion is slow this week.”- Open the Task Monitor tab.
- Filter by that team’s project ID.
- Look at “Top Time-Consuming Tasks” to find slow workflows.
- Use “Task Duration Range” to identify spikes.
- If failures are involved, go to “Task Execution Distribution” and “Overall Success Rate.”