
Purpose
The General tab gives a real-time system snapshot. It is the first place an admin should check for:- Platform stability
- Task execution patterns
- AI model activity
- User load
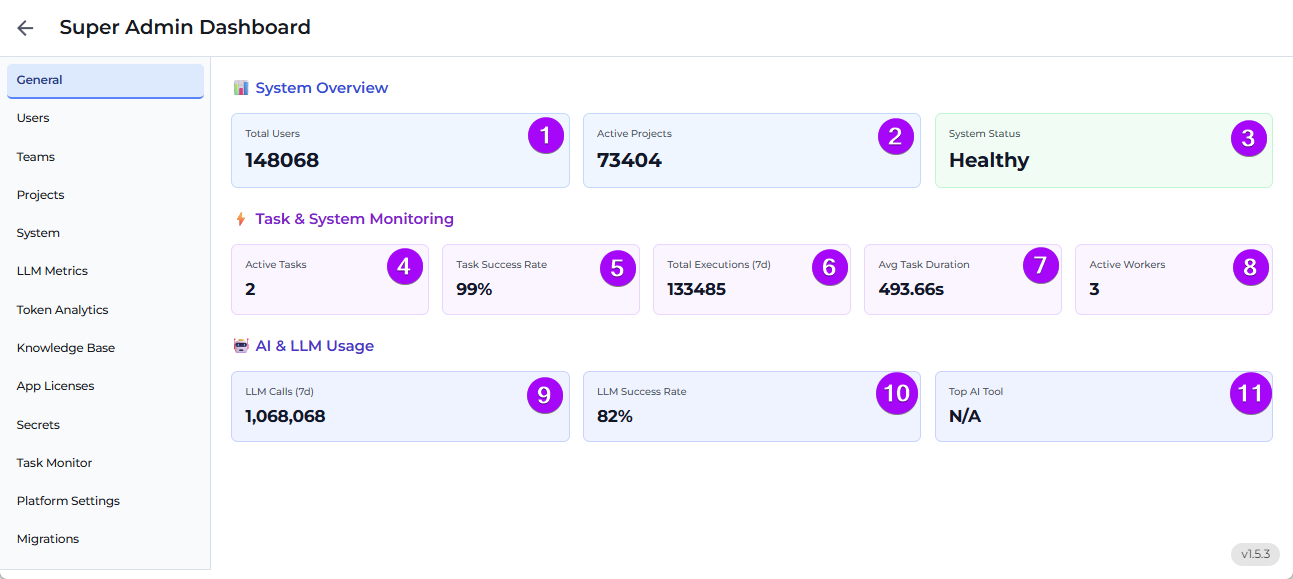
Section 1: System Overview
- Total Users: Total number of registered users in your on-prem Odin AI instance. Indicates system adoption across your organization.
- Active Projects: Count of projects that are currently running, being modified, or associated with users/teams. Reflects platform engagement.
- System Status: A quick health indicator. “Healthy” means all components (database, backend workers, LLMs, routing layers) are functioning without errors. If degraded, action is needed.
Section 2: Task & System Monitoring
This block shows how efficiently the system is processing tasks.- Active Tasks: Number of tasks currently executing in real time. If 0, the queue is idle. If high, investigate system load or delays.
- Task Success Rate: Percent of tasks that completed successfully. 100% is ideal. A drop may indicate API errors, timeouts, or bad data.
- Total Executions (7d): Total tasks (automations, LLM requests, flows, agents) executed in the last 7 days. Indicates workload trends.
- Avg Task Duration: Time taken per task on average. If duration rises suddenly, it may suggest backend slowness or heavy payloads.
- Active Workers: Number of backend compute agents (workers) currently online and processing. Low worker count can bottleneck execution.
Section 3: AI & LLM Usage
This section reflects how much AI is being used and how well it’s performing.- LLM Calls (7d): Total number of requests made to LLMs (Large Language Models) over the past 7 days. Higher count shows greater AI engagement.
- LLM Success Rate: How many LLM requests completed without timeout, failure, or bad output. A success rate below 80% may need tuning or monitoring.
- Top AI Tool: Shows which AI model or tool is most used (e.g., GPT-4, Claude, Odin Custom Agent). “N/A” means no dominant tool used yet.